Go to publication in 2025 2024 2023 2022, 2021, 2020, 2019, 2018, and 2017.
Research topics published in 2024.
Development of an evaluation method for precipitation particle types by using disdrometer data (Kondo et al., 2024)
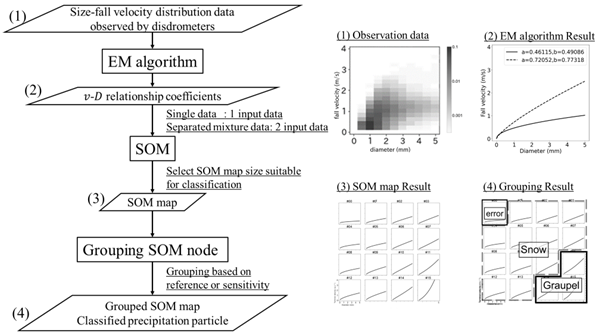
[Abstract] A method for evaluating precipitation particle types from the size-fall velocity data observed by disdrometers by combining an expectation-maximization (EM) algorithm and a self-organizing map (SOM) was developed. An EM algorithm was used to estimate the particle size-fall velocity relationships according to previous work, and the SOM map was used to classify the relationships into graupel or snow categories. The method was applied for snowfall data observed by the volume scanning video disdrometer at a site in Sapporo, Japan, and the daily graupel-to-solid precipitation ratio (G/S ratio) from 1 December, 2017 to 28 February, 2018 was obtained. The sensitivity of the results to different SOM configurations, SOM node groupings, and training datasets was also tested. The G/S ratio obtained from the simulation data of a meteorological model was compared as an example of the application of the product created by the new method.
[Reference] Kondo, M., Y. Sato, Y. Katsuyama, and M. Inatsu, 2024: Development of an evaluation method for precipitation particle types by using disdrometer data Journal of Atmospheric and Oceanic Technology, 41, 1229–1246
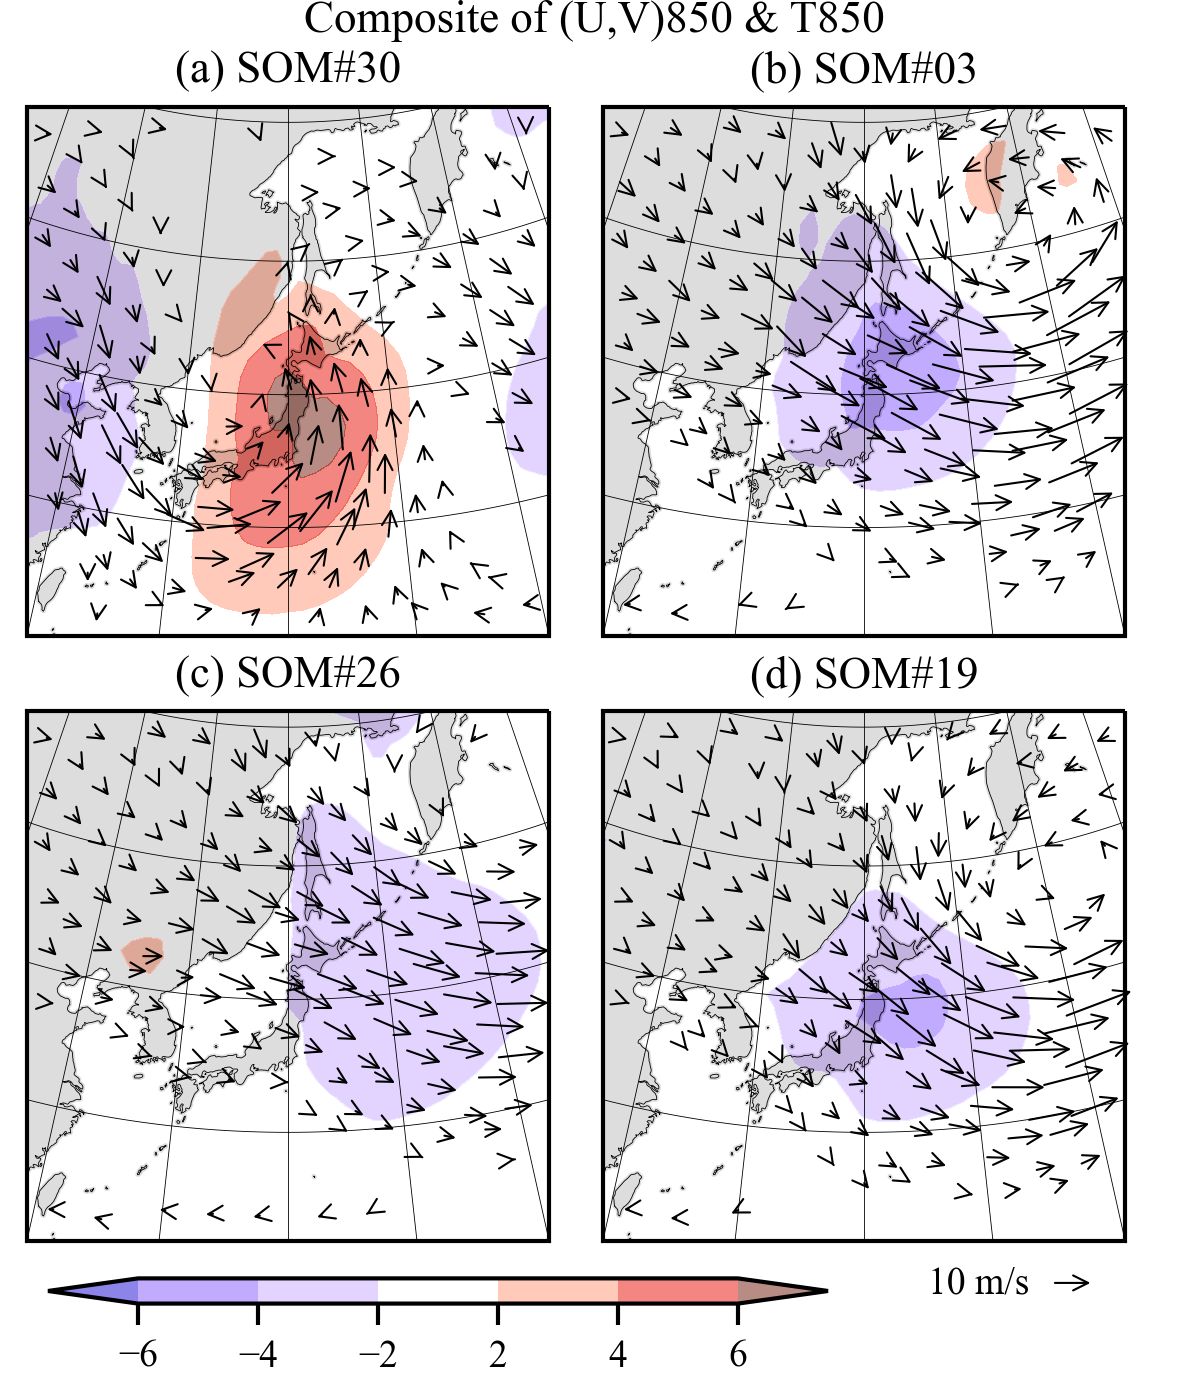
Weather classifications for high temperatures in Japanese cities (Matsuoka and Inatsu, 2024)
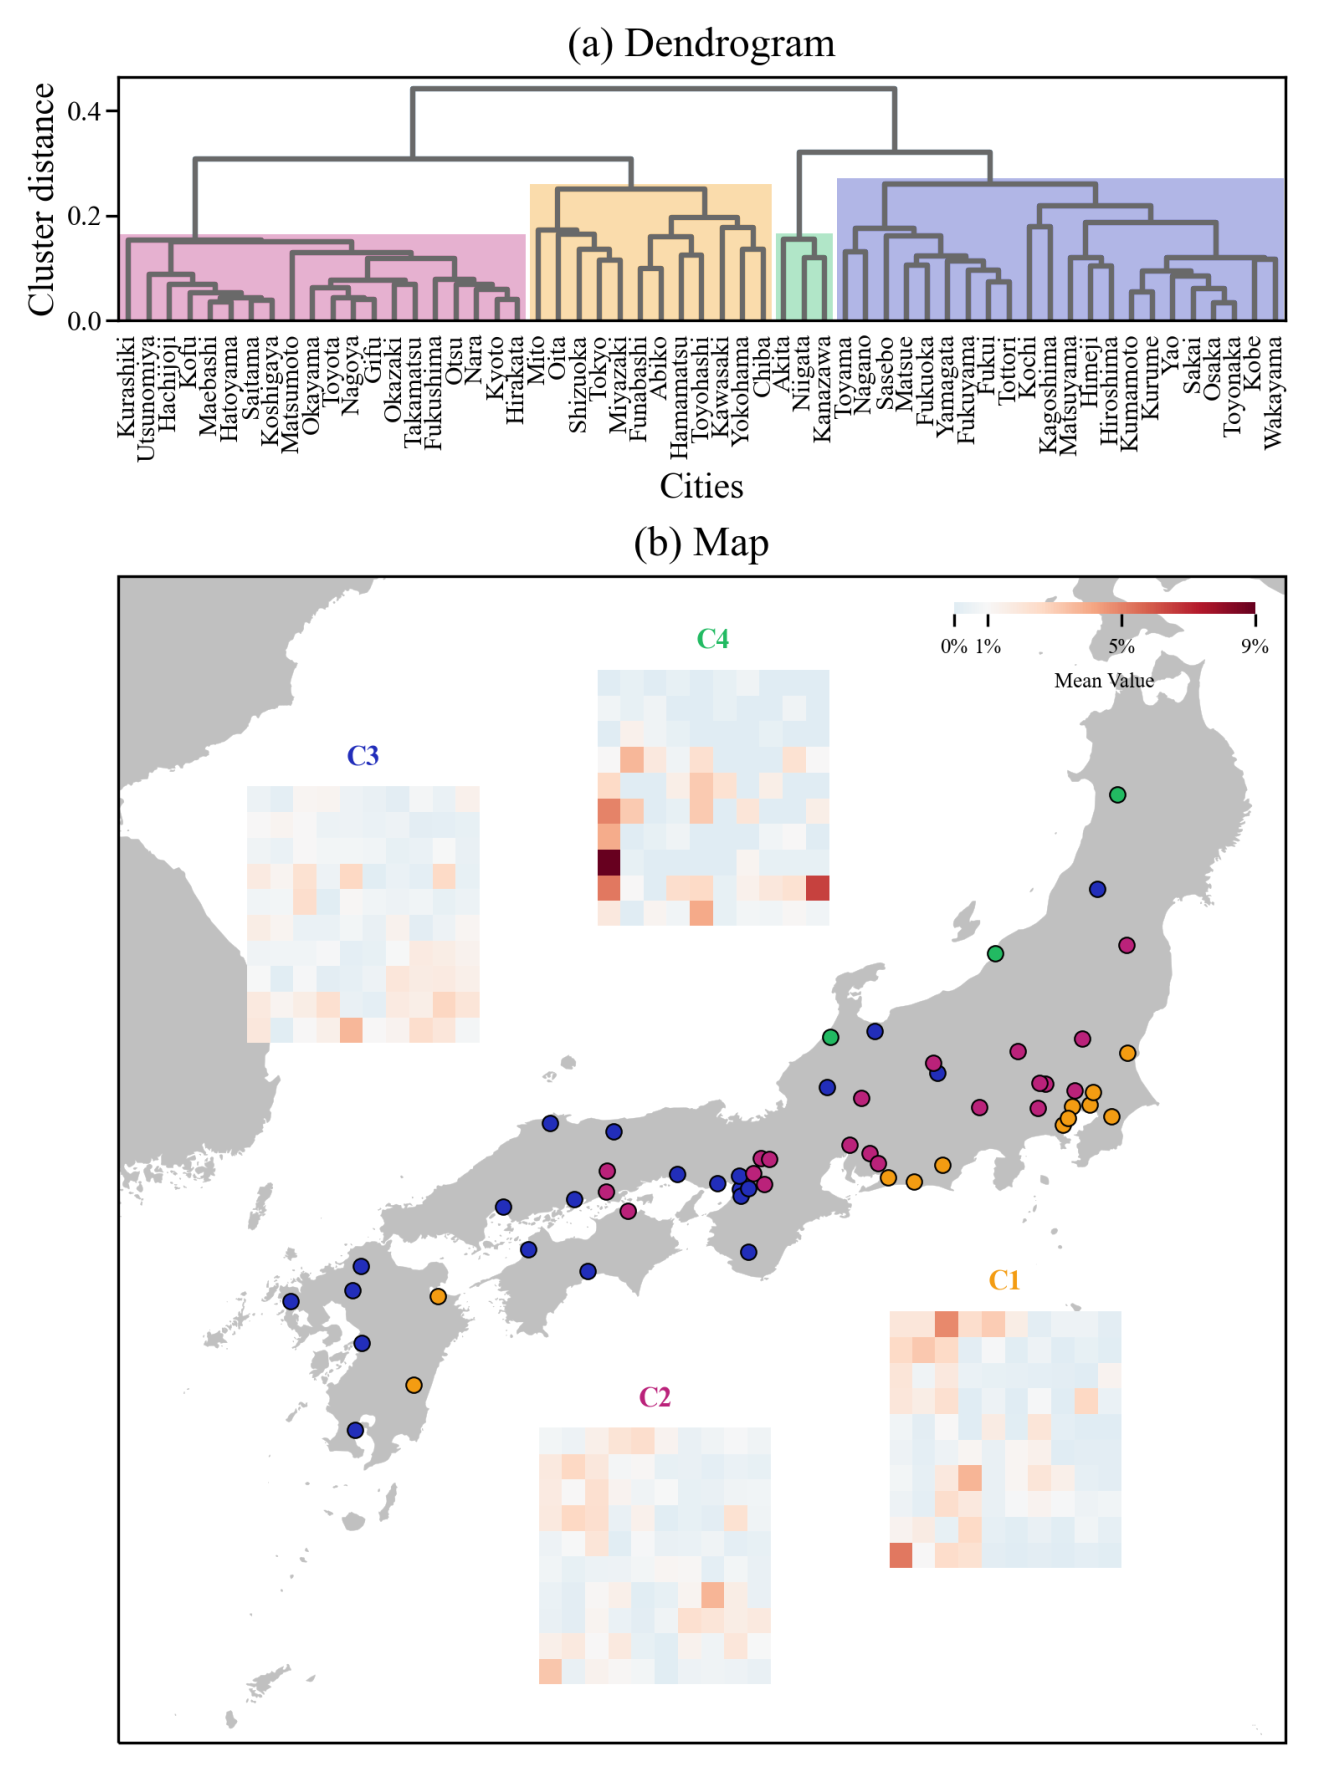
[Abstract] We present weather classifications for high temperatures in major Japanese cities. We created a self organizing map (SOM) of summer pressure patterns in Japan and generated frequency distributions of hot days on the SOM node space for each city. Through hierarchical clustering, we identified several weather zones, which tended to coincidently experience hot summer days with daily maximum temperatures of 30℃ or more, or extremely hot days with daily maximum temperatures of 35℃ or more. The obtained weather zones for hot summer days partially followed a local climate classification previously proposed in geography. In contrast, weather zones for extremely hot days lacked geographical continuity and were rather related to whether the sites are inland or coastal. This suggested that extremely hot days were frequently caused by the foehn phenomenon.
[Reference] Matsuoka, R. N., and M. Inatsu, 2024: Weather classifications for high temperatures in Japanese cities. Scientific Online Letters on the Atmosphere, 20, 298 305.
Climate change assessment on blowing snow in Hokkaido using a large ensemble dataset (Sugawara et al., 2024)
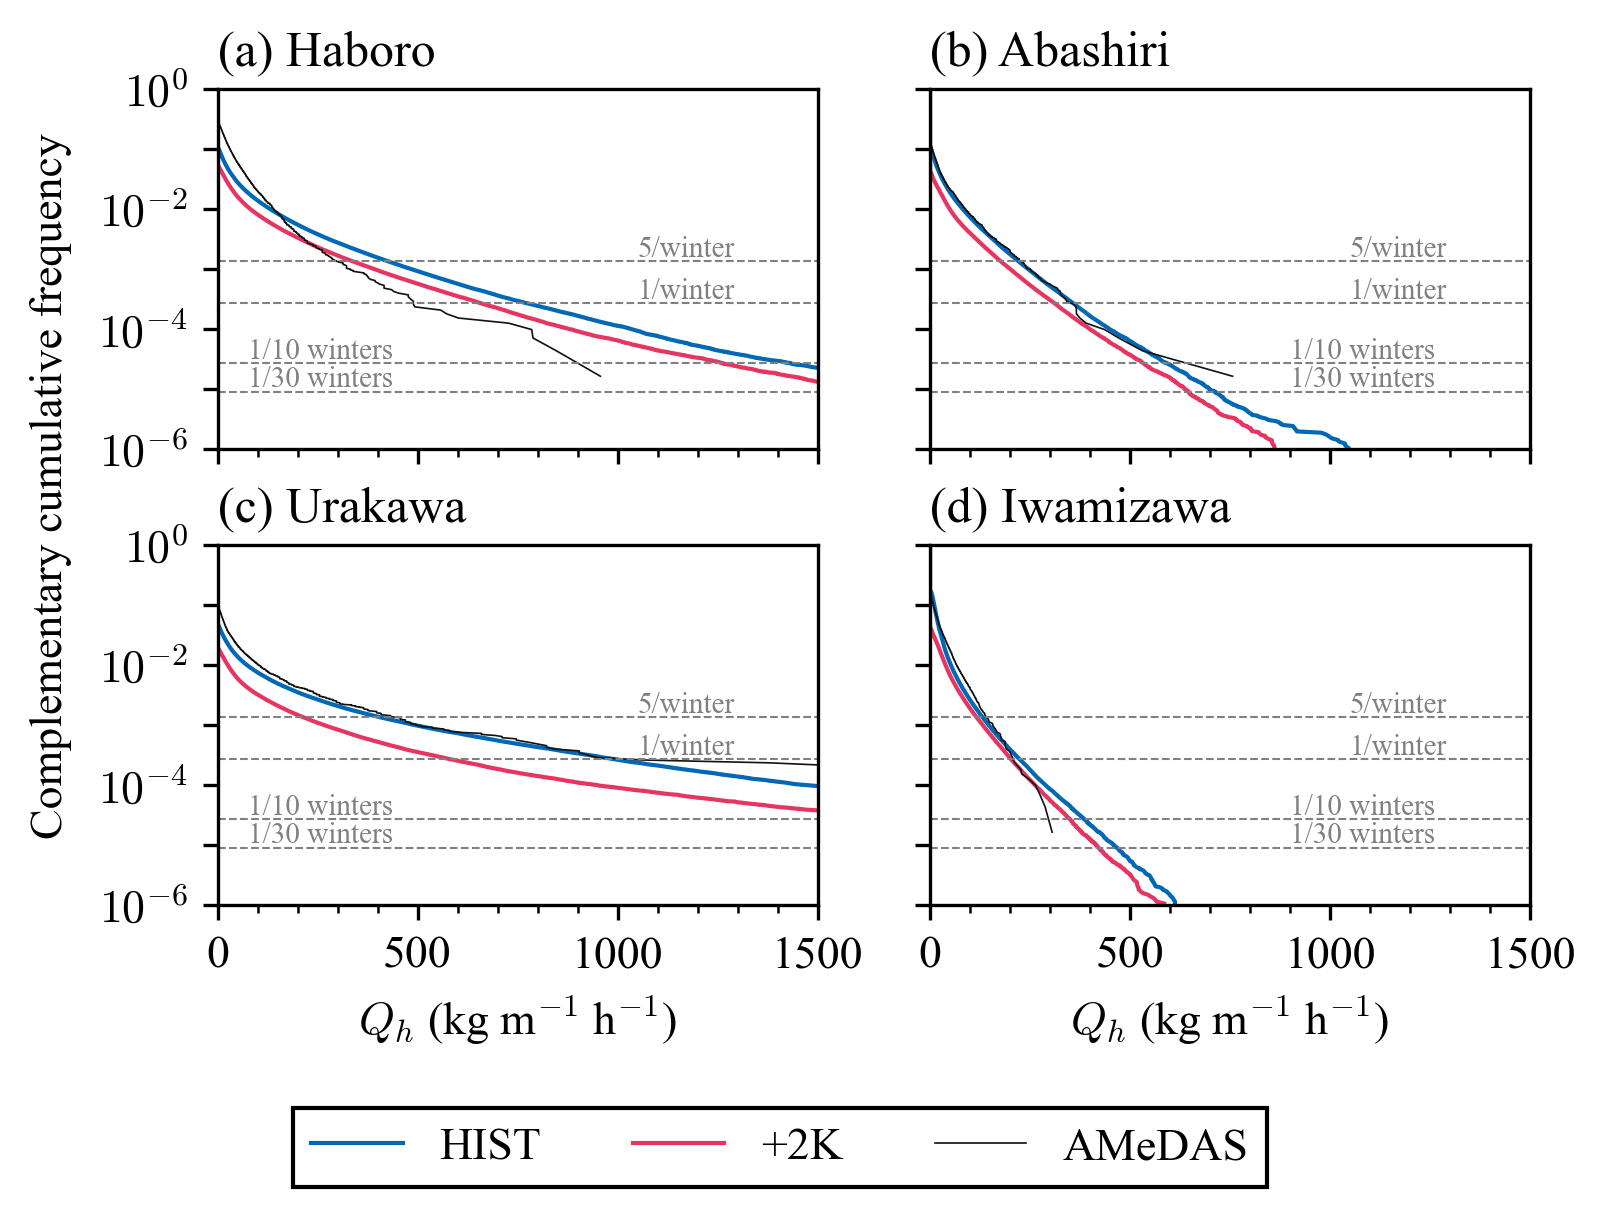
[Abstract] This study evaluated the impact of climate change on the intensity of blowing-snow events across a wide probability spectrum including extreme events by a dynamically-downscaled meteorological dataset with a large number of ensembles called d4PDF. Focusing on four sites in Hokkaido, the hourly snow transport rate (STR) was estimated from wind speed, temperature, and snowfall. The historical experiment of d4PDF can reproduce the observed distribution of STR. The +2K experiment of d4PDF indicated that the severe blowing-snow events became rarer. Moreover, the monthly maximum STR exhibited a decrease, yet it showed significant spatial differences and seasonal variations. The monthly maximum STR and its drifting term in the mid-winter was the most significantly reduced at a site along the Pacific coast. At this site, the mean snow-covered duration (SCD) from December to February was shorter than that of the other sites. Such a decrease in STR would be due to the shortening of the SCD and the substantially related to the critical temperature at the freezing point.
[Reference] Sugawara, K., M. Inatsu, and Y. Harada, 2024: Climate change assessment on blowing snow in Hokkaido using a large ensemble dataset. Scientific Online Letters on the Atmosphere, 20, 217 222.
Future Change in the Contribution of Riming and Depositional Growth to the Surface Solid Precipitation in Hokkaido, Japan (Sato et al., 2024)
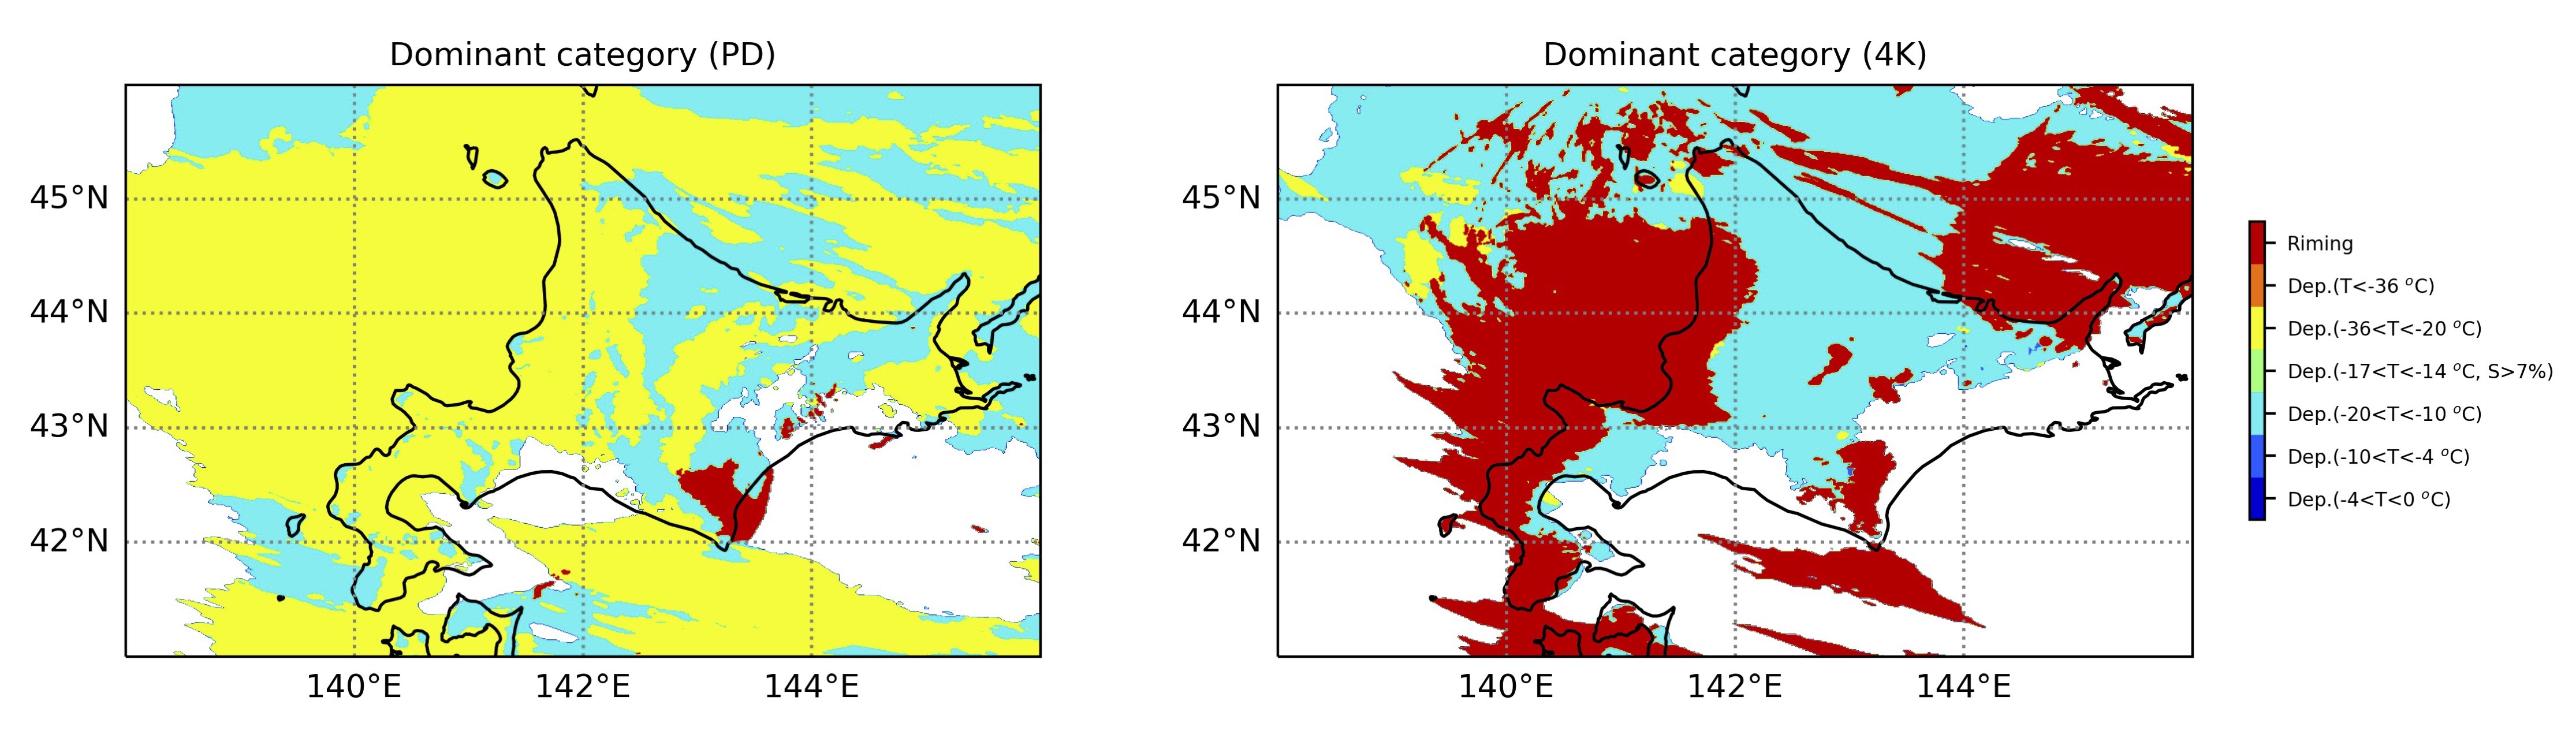
[Abstract] This study examined future changes in the microphysical properties of surface solid precipitation over Hokkaido, Japan. A process-tracking model that predicts the mass of the hydrometeors generated by each cloud microphysical process was implemented in a meteorological model. This implementation aimed to analyze the mass fraction of hydrometeors resulting from depositional growth and the riming process to the total mass of surface solid precipitation. Results from pseudo–global warming experiments suggest two potential future changes in the characteristics of surface solid precipitation over Hokkaido. First, the rimed particles are expected to increase and be dominant over the west and northwest coast of Hokkaido, where heavy snowfall occurs primarily due to the lake effect. Second, the mass fraction from depositional growth under relatively higher temperatures is expected to increase. This increase is anticipated to be dominant over the eastern part and mountainous area of Hokkaido. Additionally, the fraction of liquid precipitation to total precipitation is expected to increase in the future. These results suggest that the microphysical properties of solid precipitation in Hokkaido are expected to be similar to those observed in the current climate over Hokuriku, the central part of Japan even in warmer climate conditions.
[Reference] Sato, Y., M. Kamada, A. Hashimoto, and M. Inatsu, 2024: Future Change in the Contribution of Riming and Depositional Growth to the Surface Solid Precipitation in Hokkaido, Japan Journal of Applied Meteorology and Climatology, 63, 1097-1112
Impact of Model Grid Spacing on the Feedback between Shortwave Three-Dimensional Radiative Transfer and an Isolated Nonprecipitating Cumulus.(Hirata et al., 2024)
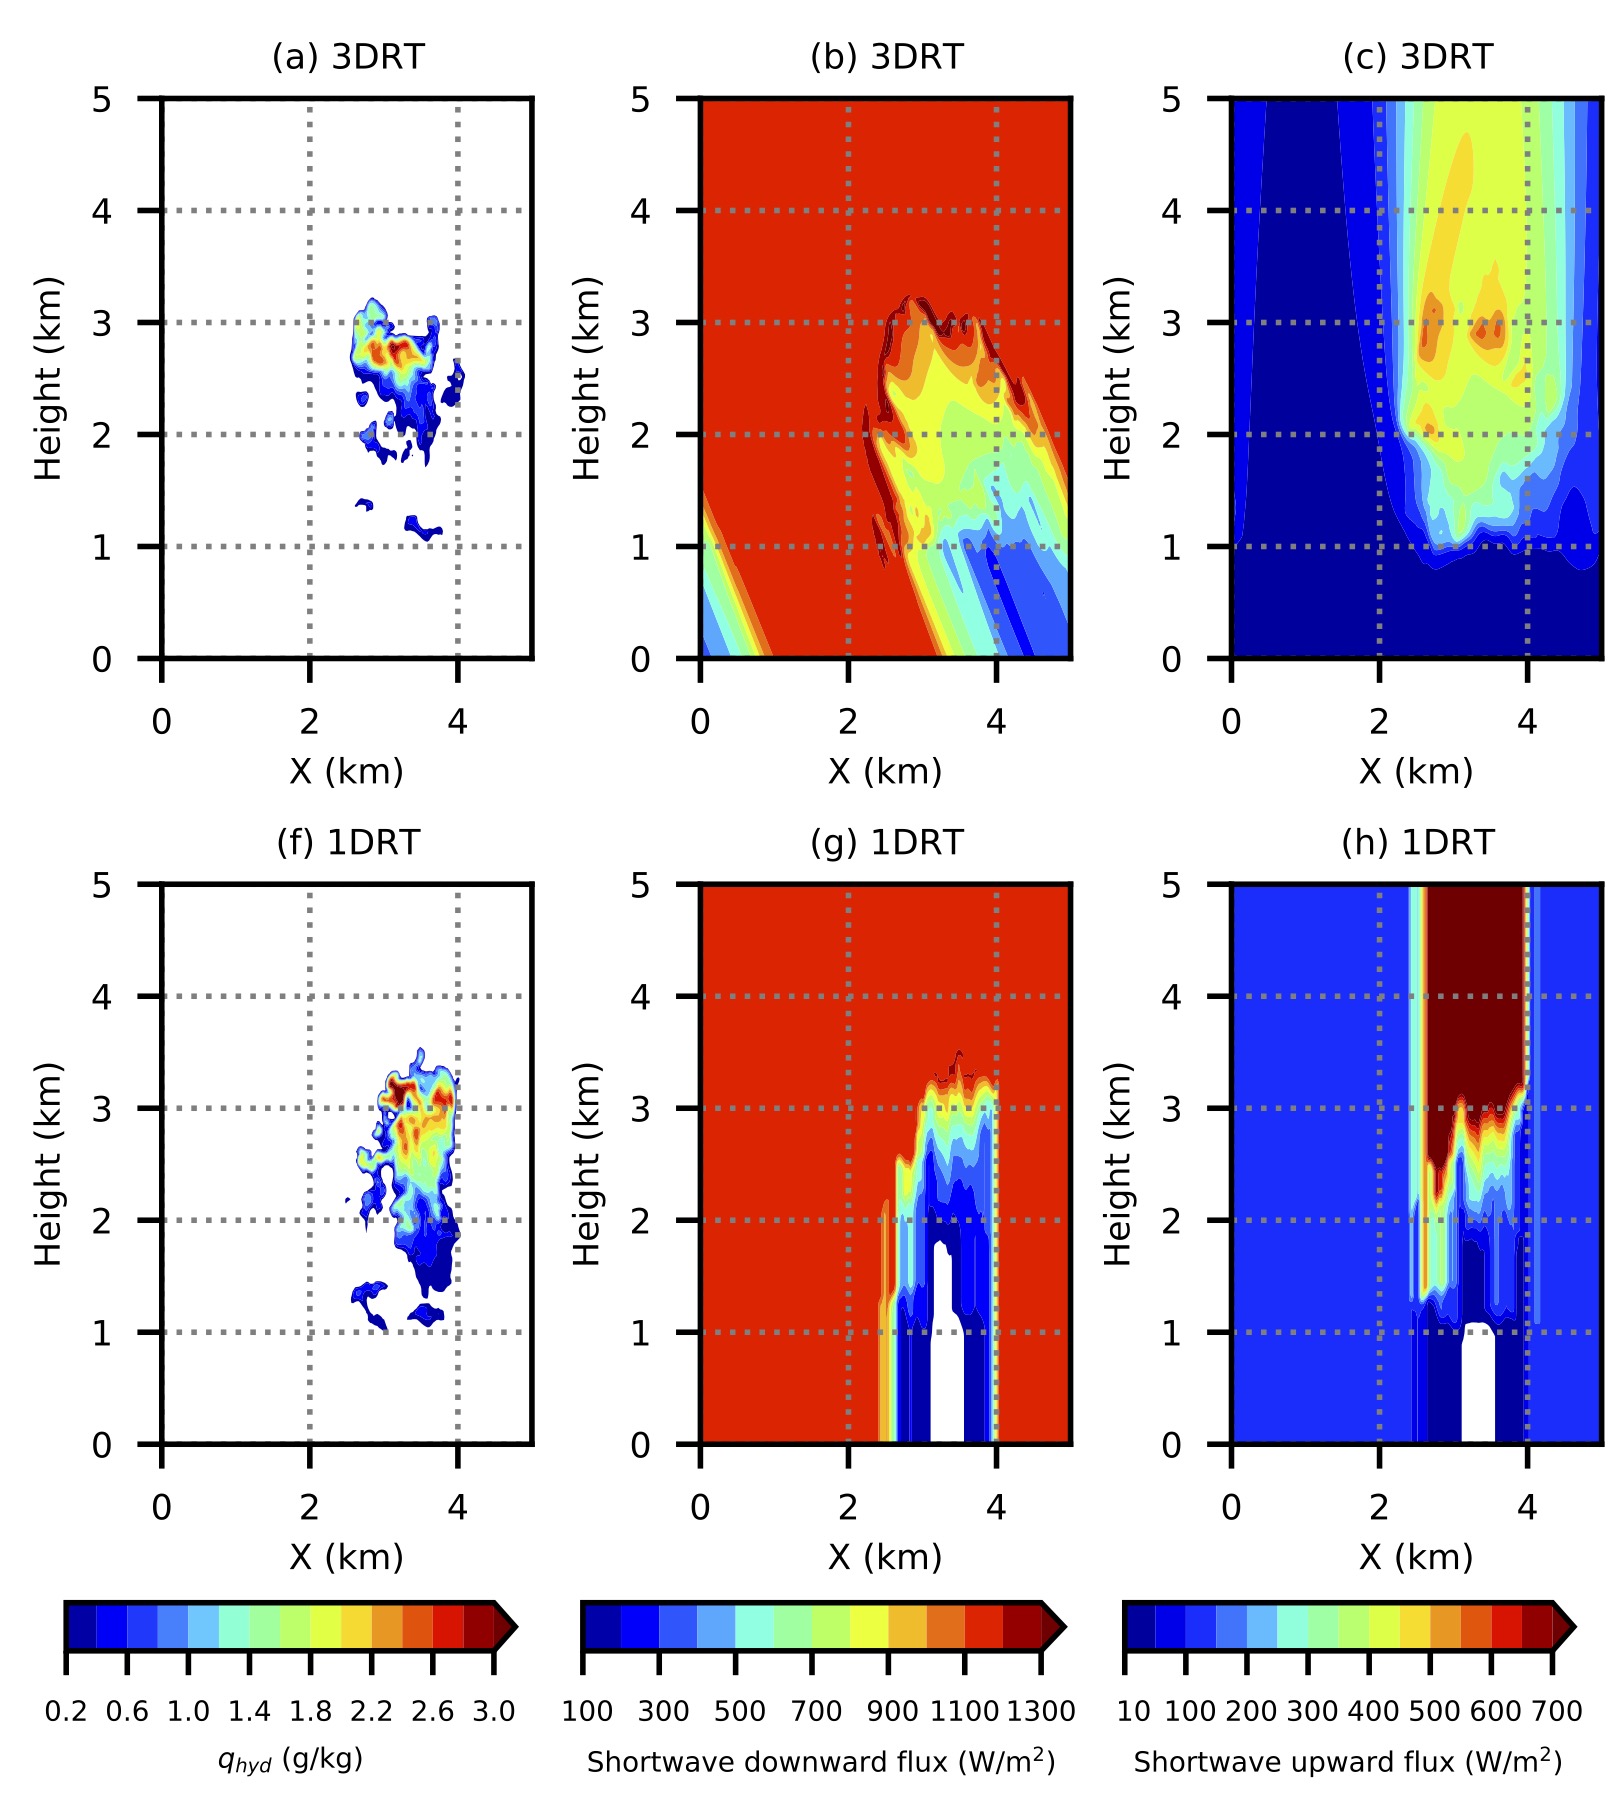
[Abstract] This study investigates the dependency of the shortwave three-dimensional radiative transfer (3D RT) effects upon the grid width when simulating an isolated cumulus. A meteorological model coupled with a 3D RT model enables us to investigate the dependency through simulations which consider feedback of the 3D RT to the atmosphere. Using the coupled model, simulations of the isolated cumulus were conducted for grid widths ranging between 25 m and 500 m. The same series of simulations were also conducted using a conventional one-dimensional (1D) radiative transfer model and were compared with the results by the 3D RT model. The comparison clarifies that the discrepancy in liquid water path between the two RT schemes becomes more prominent with smaller grid widths. The comparison also indicates that the difference in the radiative heating is negligible for grid spacing of 500 m but was substantial for finer grid spacings. These results suggest that the 3D RT model is required to accurately simulate the feedback between clouds and shortwave radiation for an isolated cumulus with grid widths of at least 250 m or smaller, when the lateral edge of the cloud is spatially resolved.
[Reference] Hirata, K., Y. Sato, M. Sekiguchi, and M. Inatsu, 2024: Impact of Model Grid Spacing on the Feedback between Shortwave Three-Dimensional Radiative Transfer and an Isolated Nonprecipitating Cumulus SOLA, 20, 273-280
Research topics published in 2023.
Stochastic precipitation model using large ensemble data.(Shinohara and Inatsu, 2023)
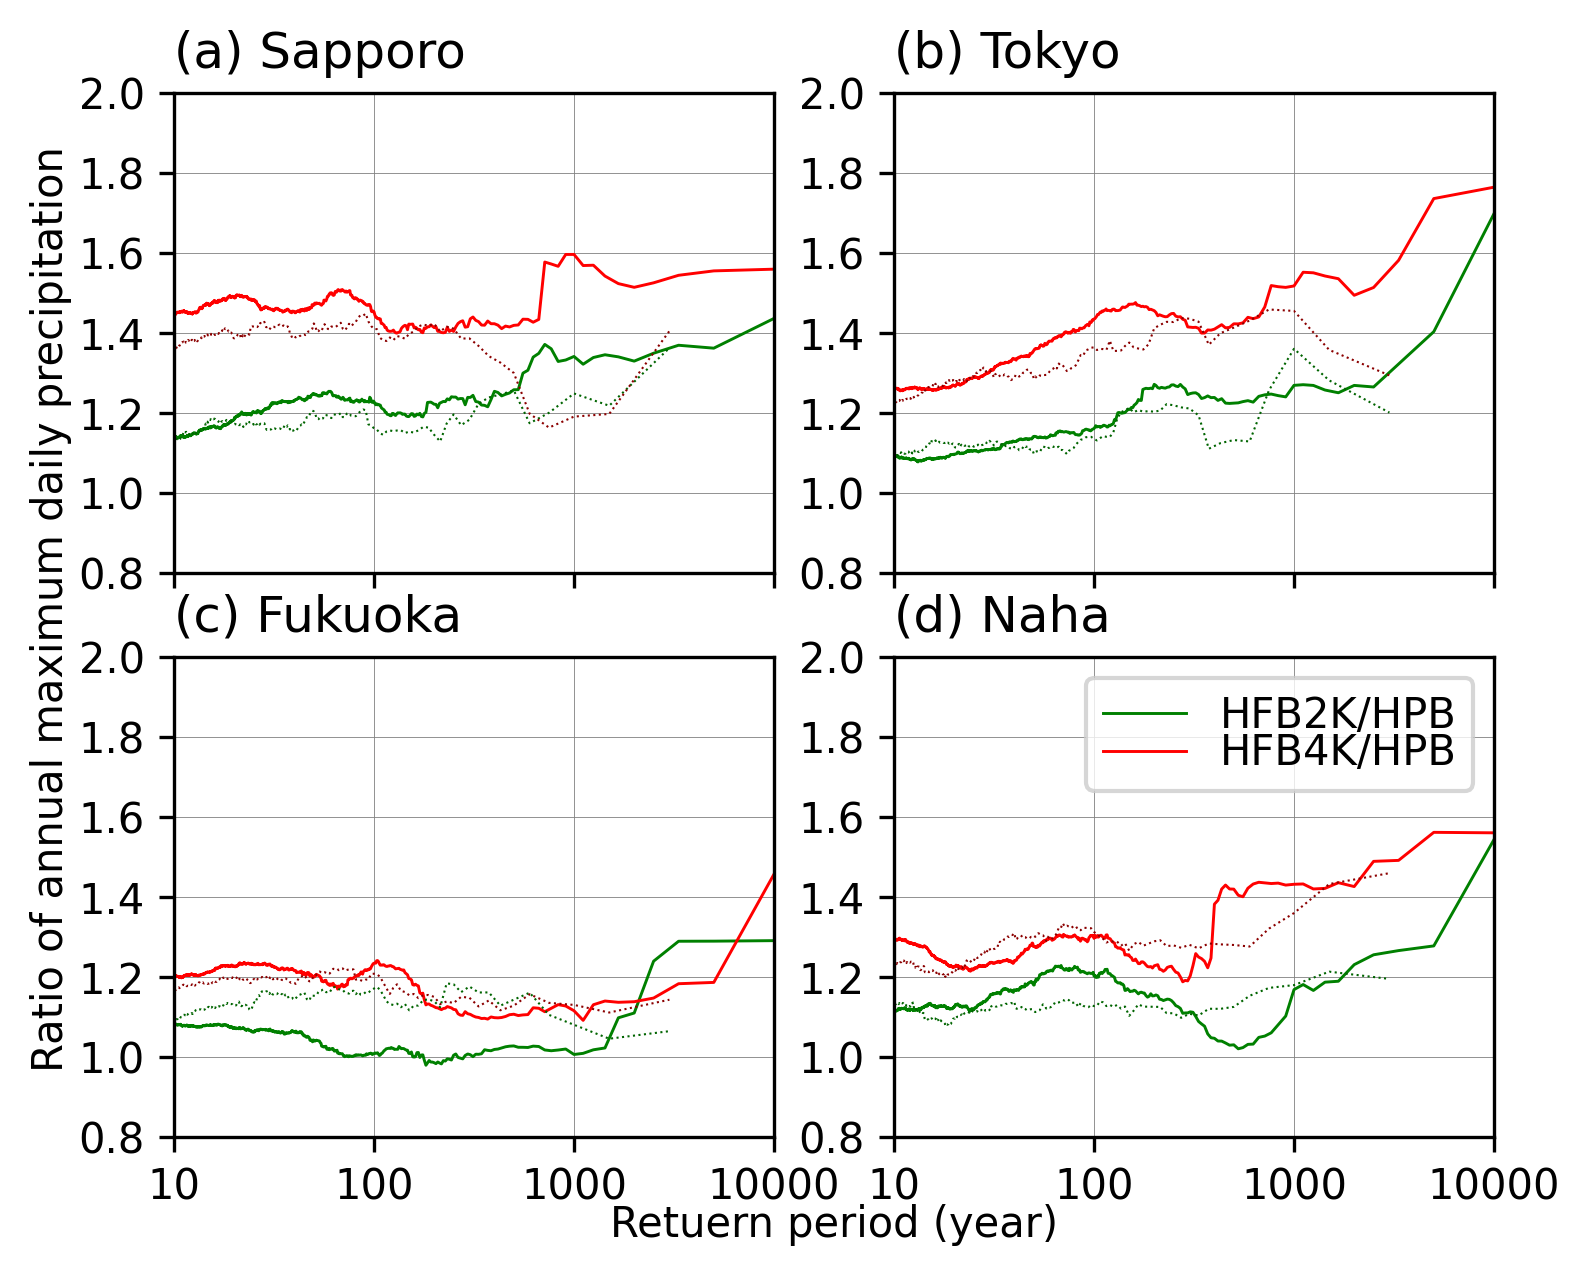
[Abstract] A precipitation dataset is created to estimate a reproduction period of several thousand years for stochastic flood risk assessment in the non-life insurance sector. A stochastic precipitation model for natural hazard risk assessment developed in a previous study was applied to a large ensemble data. The model was used to obtain the precipitation ensembles for the recent and future climate by +2 K and +4 K increases in mean temperature, respectively. We successfully created 10,000 years of precipitation data, which makes it possible to obtain precipitation data over a 1,000-year return period.
[Reference] Shinohara M., and M. Inatsu, 2023: Stochastic Precipitation Model Using Large Ensemble Data Journal of Disaster Research, 18, 868-876
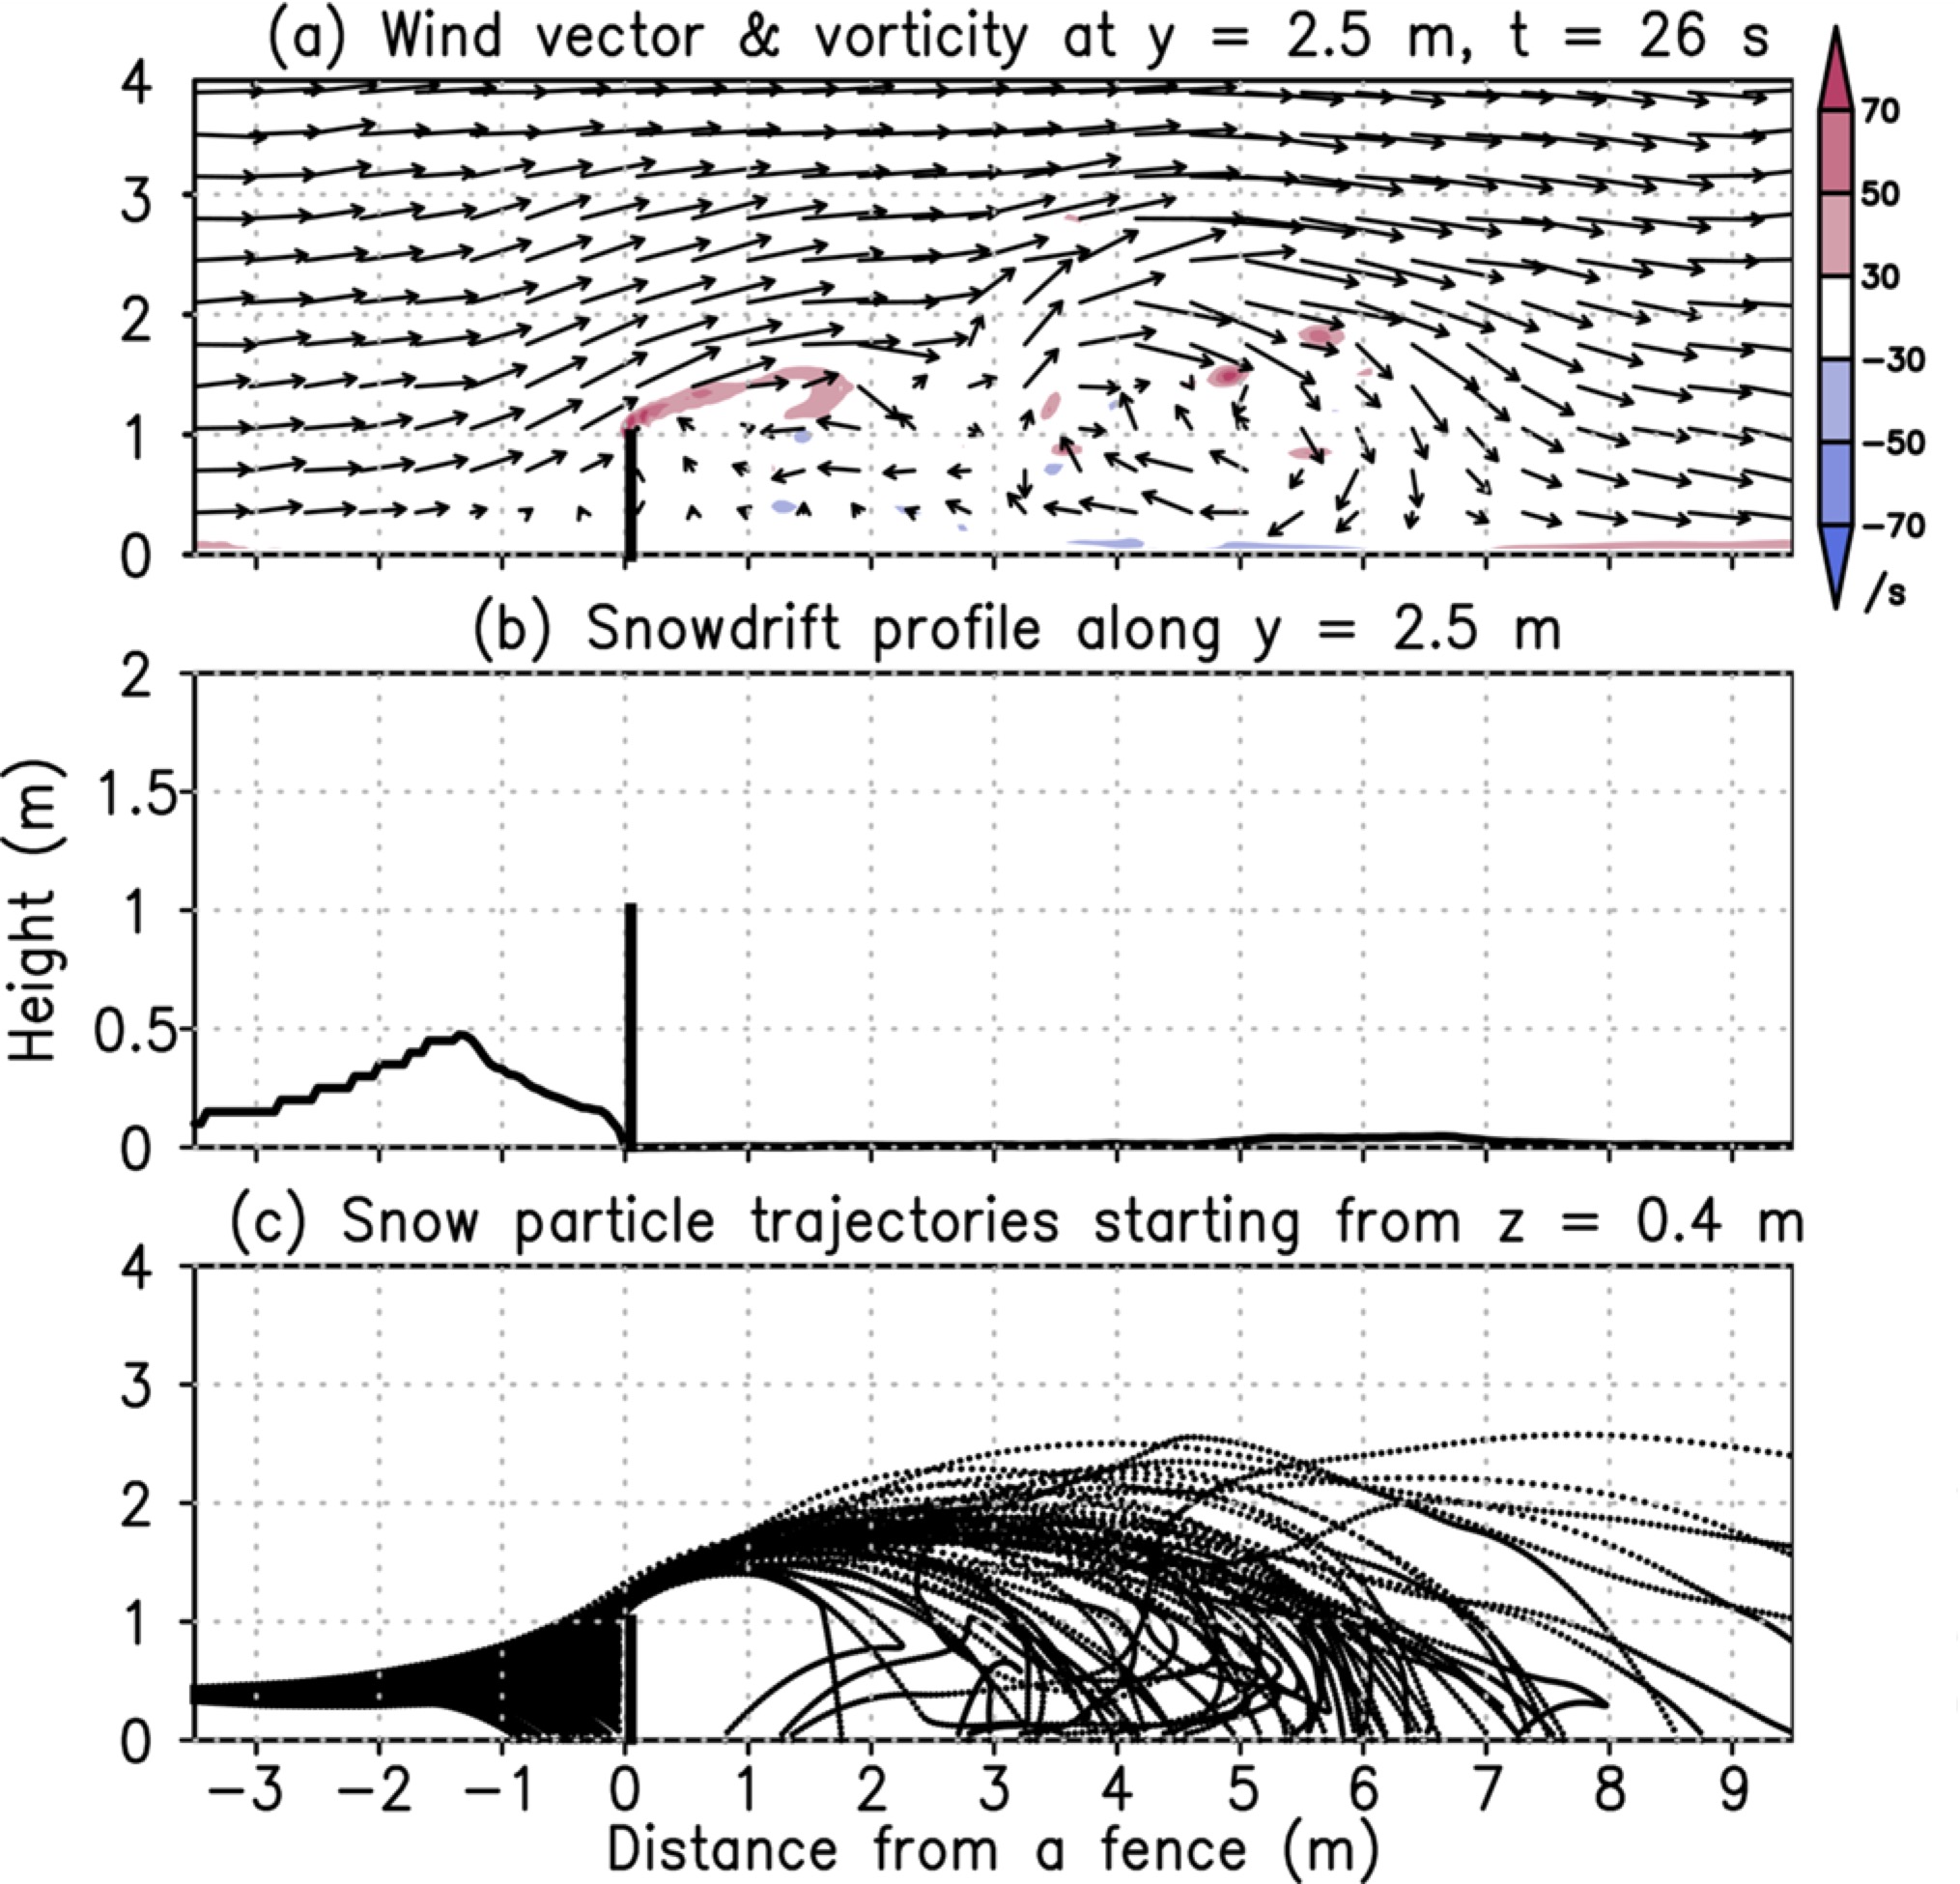
Comparison of the LBM snowdrift model output with observation results.(Tanji et al., 2023)
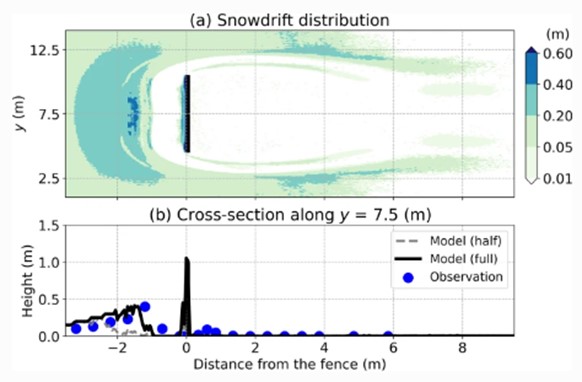
[Abstract] In this work, snowdrift experiments which are equivalent to one drifting snow event are performed by the snowdrift model. The model consisted of the computational fluid dynamics part of the large-eddy simulation with the lattice Boltzmann method and the drifting snow part of the conventional advection algorithm for representative Lagrangian particles. The observed vertical wind profile of a 4 h drifting snow event in Teshikaga Town was used as the inflow boundary conditions in the model to compare the results of the snowdrift estimated by the model and the observed snowdrift distribution. Parallelization enabled us to simulate the snowdrift distribution in a realistic domain and on the time scale of a single drifting snow event. We demonstrated that the upgraded model could quantitatively reproduce the height and position of the observed snowdrift along the center of a three-dimensional fence.
[Reference] Tanji, S., M. Inatsu, and Y. Harada, 2023: Comparison of the LBM snowdrift model output with observation results. Progress in Earth and Planetary Science, 8, 57.
Snow melting estimate in the Jozankei dam basin based on snowpack simulation. (Taniguchi et al., 2023)
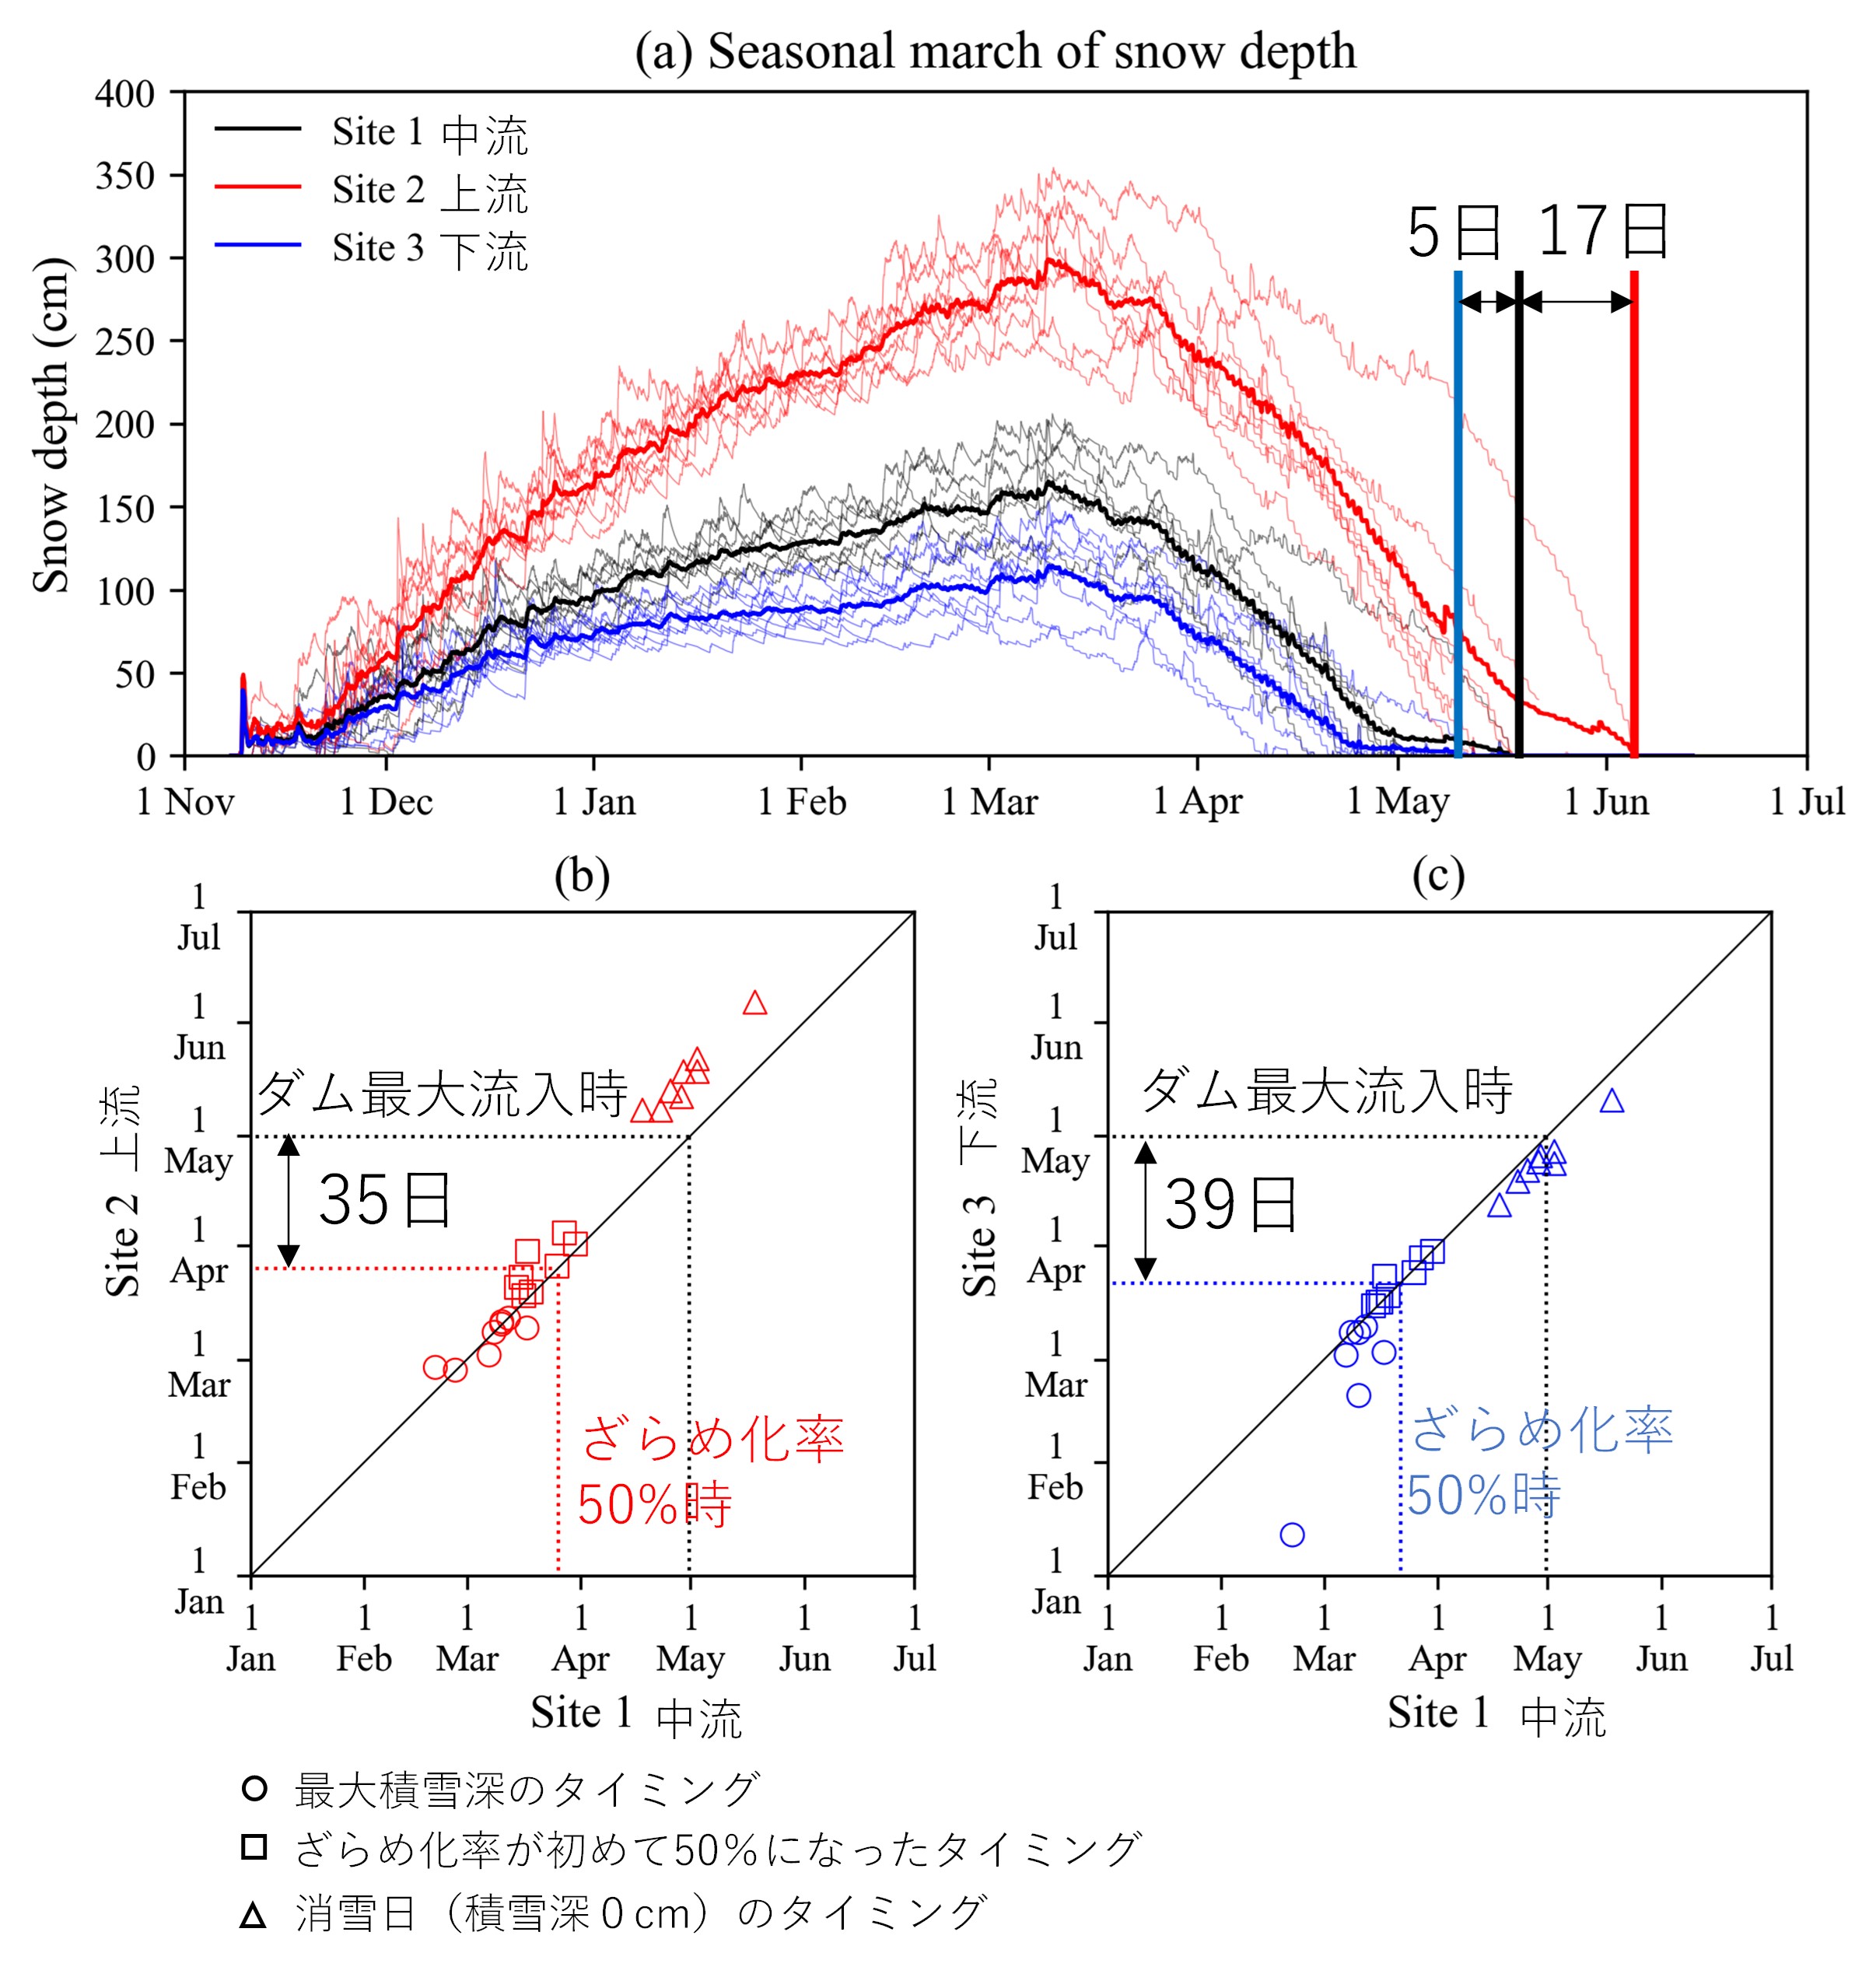
[Abstract] A physical snowpack model was forced by observed meteorological data to map the snow melting distribution over the Jozankei Dam basin, Sapporo, Japan. First, the snowpack model experiment forced by radar precipitation reasonably reproduced the snow environment in the basin, although it underestimated the snow depth in the northern area. Second, the map of the basin showed that the average difference in snowmelt was 22 days between upstream and downstream. On the other hand, the timing when melt forms become dominant in the snow layer was little affected by altitude and precipitation, and the dam inflow attained the peak 35 to 40 days after then.
[Reference] Taniguchi, Y., Y. Katsuyama, M. Inatsu, and T. Yamada, 2023: Snow melting estimate in the Jozankei dam basin based on snowpack simulation. Scientific Online Letters on the Atmosphere, 19, 274–281, doi:10.2151/sola.2023-036.
Advantage of bulk lightning models for predicting lightning frequency over Japan. (Tomioka et al., 2023)
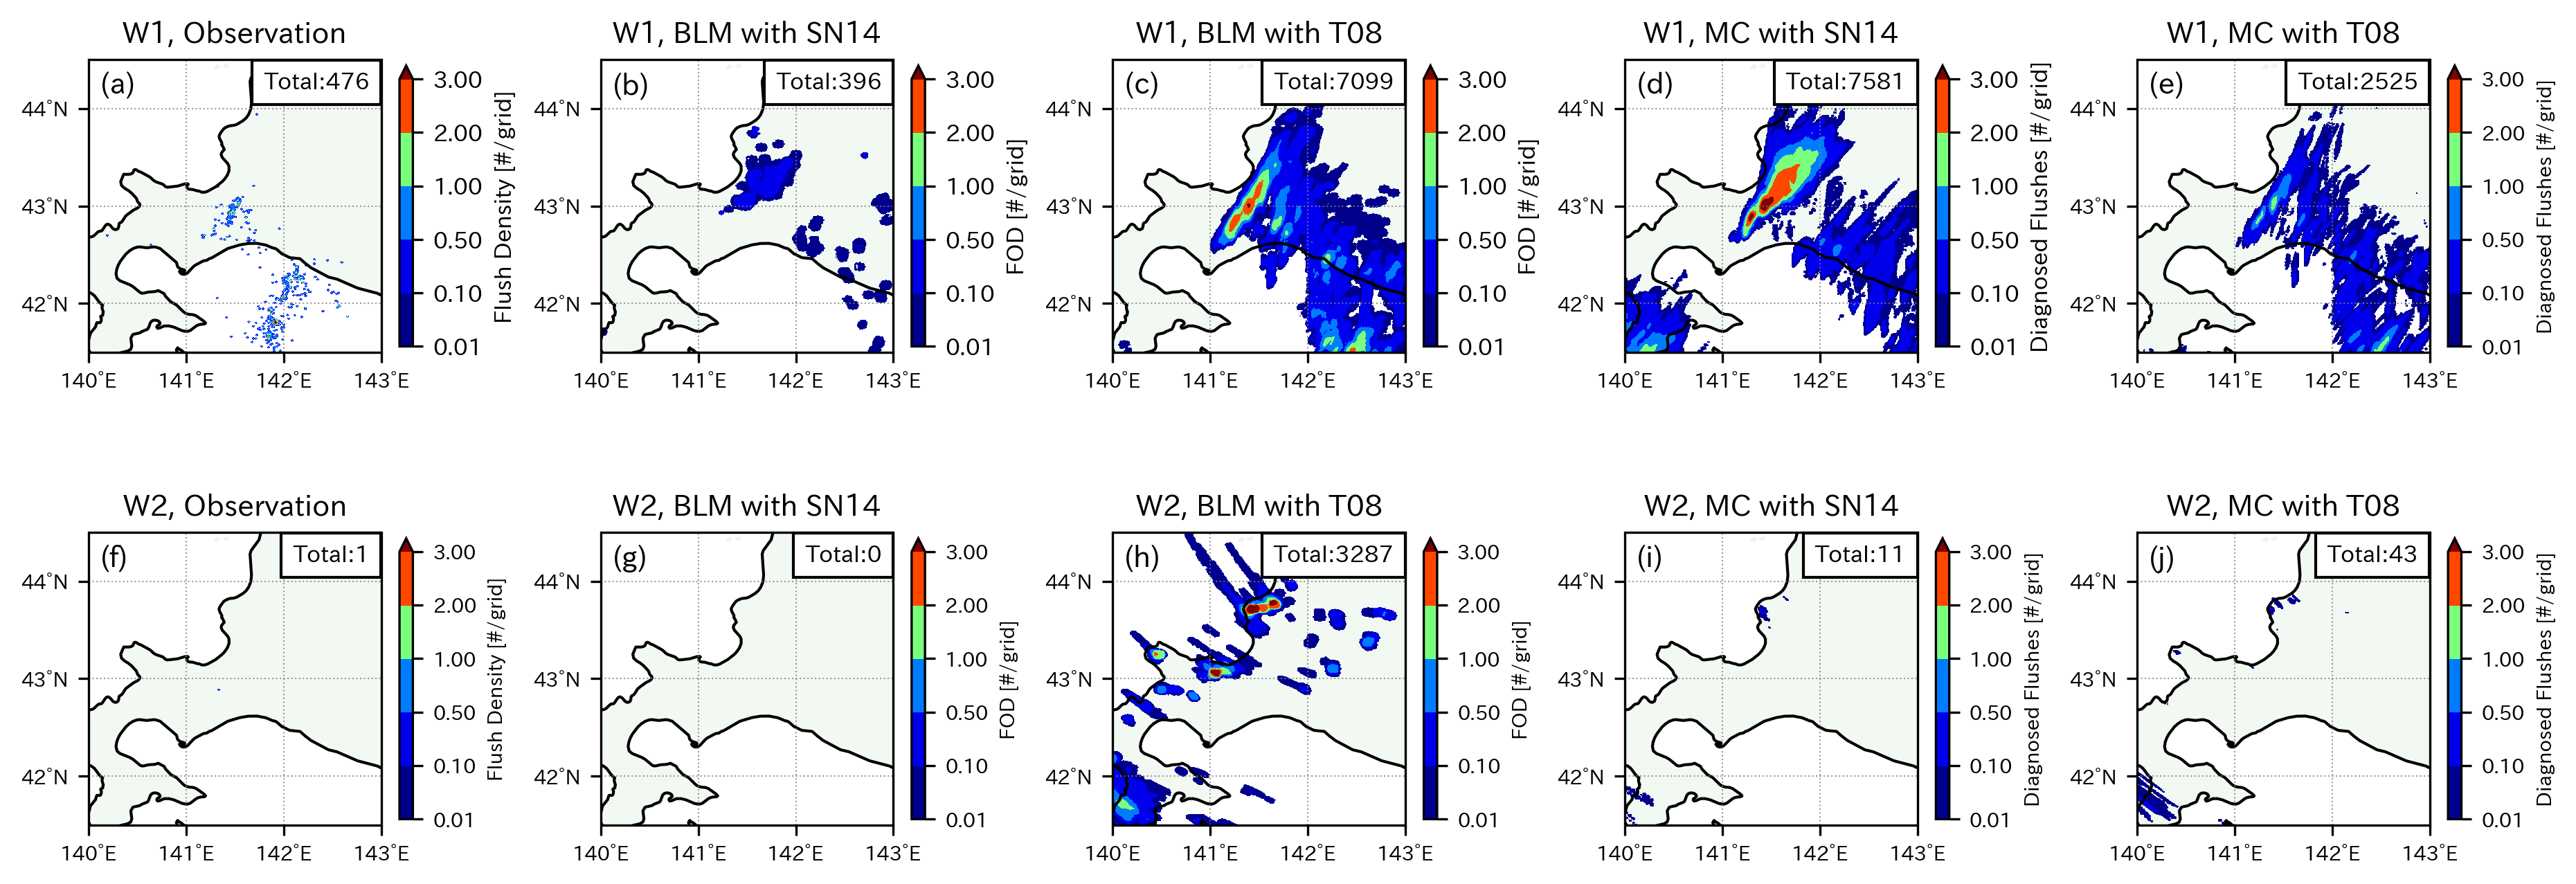
[Abstract]This study examined the performance of an explicit bulk lightning model coupled with a meteorological model for forecasting lightning by numerical weather prediction over Japan. The evaluation was conducted by comparing the lightning predicted by the explicit bulk lightning model, diagnosed empirically by the numerical model, and observed by ground base measurements. From the results, the bulk lightning model performed better in terms of lightning frequency than did the diagnostic scheme, which overestimated the lightning frequency, although there were no appreciable differences in the score of each method for the geographical distribution and time correlation compared with the observations. These results suggest that the explicit bulk lightning model is advantageous for predicting lightning frequency. The sensitivity of the simulated lightning to the choice of cloud microphysical model was also examined by using a two-moment and a one-moment bulk microphysical scheme. Sensitivity experi- ments on the choice of microphysical model indicated that the two-moment bulk scheme reproduced the observed lightning well, while the one-moment bulk scheme overestimated the lightning frequency. Analyses suggested that the overestimation of the lightning in the one-moment bulk scheme originated from active charge separation by riming electrification, in which graupel was produced more frequently and was assumed to fall faster. These results suggest that the explicit bulk lightning model with the two-moment bulk microphysical scheme offers an alternative to conventional lightning prediction methods.
[Reference] Tomioka, T., Y. Sato, S. Hayashi, S. Yoshida, and T. Iwashita, 2023: Advantage of bulk lightning models for predicting lightning frequency over Japan. Progress in Earth and Planetary Science, 10(60), doi:10.1186/s40645-023-00592-w
Evaluation of tornadic environments and their trends and projected changes in Japan. (Kawazoe et al., 2023)
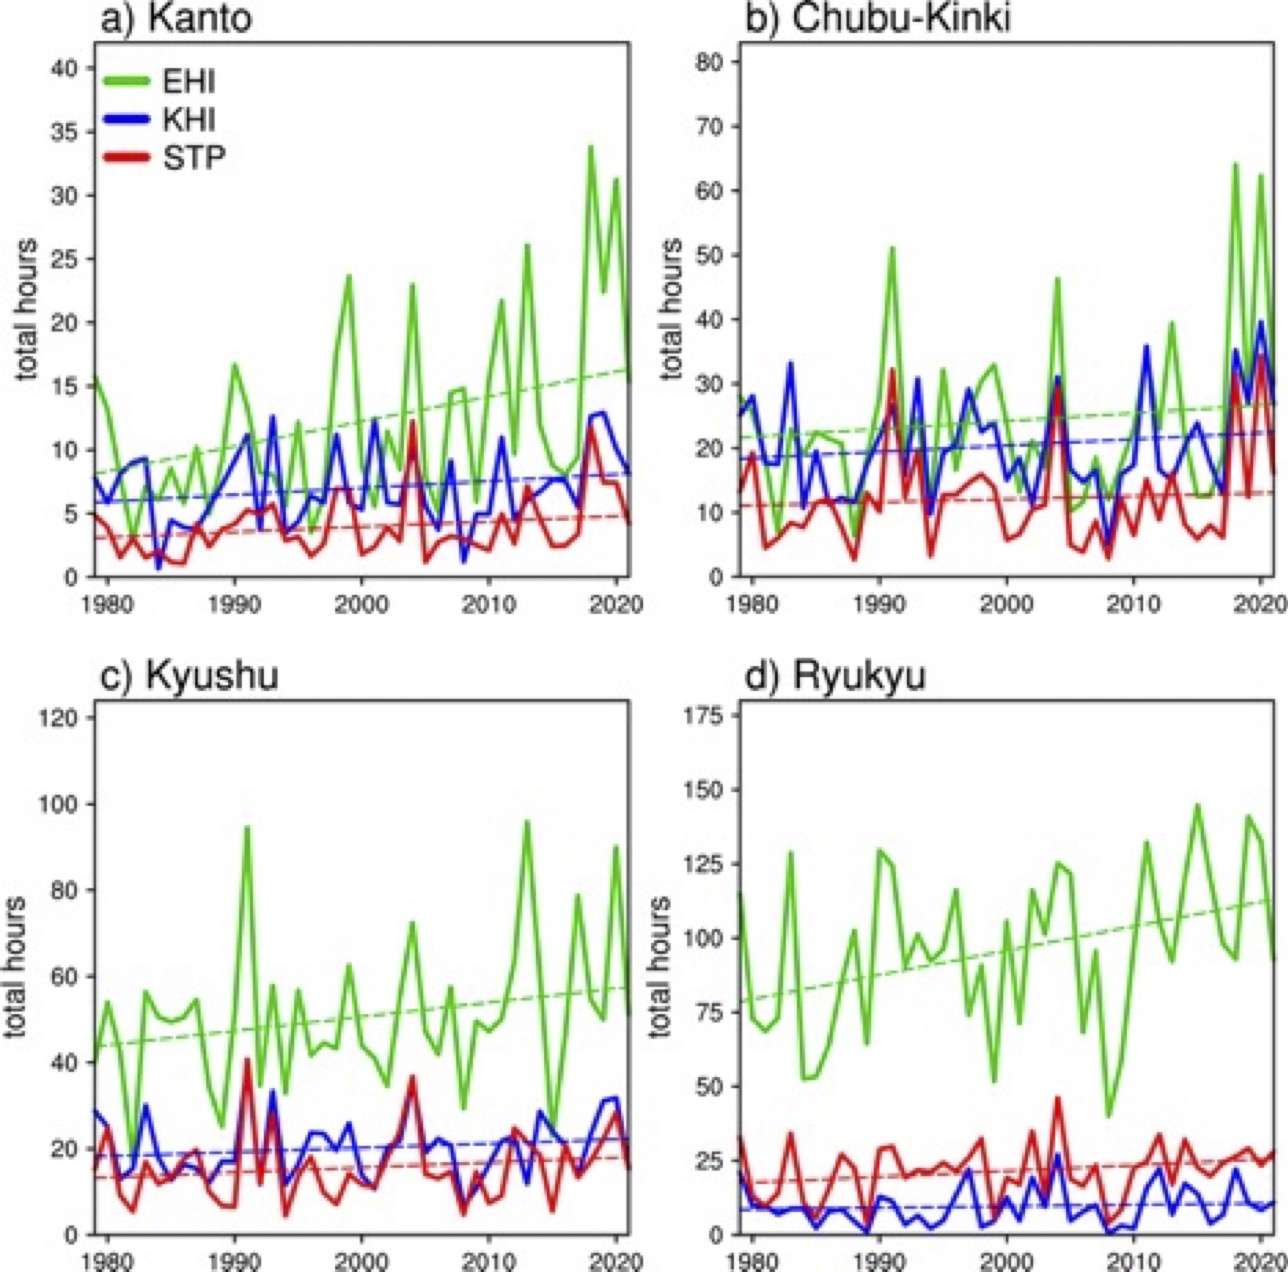
[Abstract] Tornadoes are responsible for several high-impact weather disasters in Japan. However, little is known about how these events have changed over the last several decades or how they may change in future climates. This study examines environmental conditions associated with tornados in Japan using pseudo-soundings from the high-resolution fifth-generation ECMWF reanalysis. We first determine appropriate discriminators of F2+ tornadoes using thermodynamic (convective available potential energy, convective inhibition, lifting condensation level, and the K-index), kinematic (bulk wind difference and storm-relative helicity), and multivariate tornado parameters (energy helicity index, K-helicity index, and the significant tornado parameter), and confirm that F2+ tornadoes occur in environments with higher instability and helicity, but are better distinguished using multivariate parameters. Recent trends indicate that F2+ environments have increased significantly in some regions over the last four decades. We also examined future changes for each parameter using a large ensemble 2-K warming experiment. Robust increases in strong tornado environments are depicted in many regions in Japan, particularly on the Sea of Japan side and the Kanto region. This indicates that despite projected decreases in bulk wind difference and higher convective inhibition, significant increases in atmospheric instability compensate, leading to more days with F2+ tornado potential.
[Full Reference] Kawazoe, S., M. Inatsu, M. Fujita, S. Sugimoto, Y. Okada, and S. Watanabe, 2023: Evaluation of tornadic environments and their trends and projected changes in Japan npj Climate and Atmospheric Science, 6 doi:10.1038/s41612-023-00524-x
A numerical study of lightning-induced NOx and formation of NOy observed at the summit of Mt. Fuji using an explicit bulk lightning and photochemistry model (Sato et al., 2023)
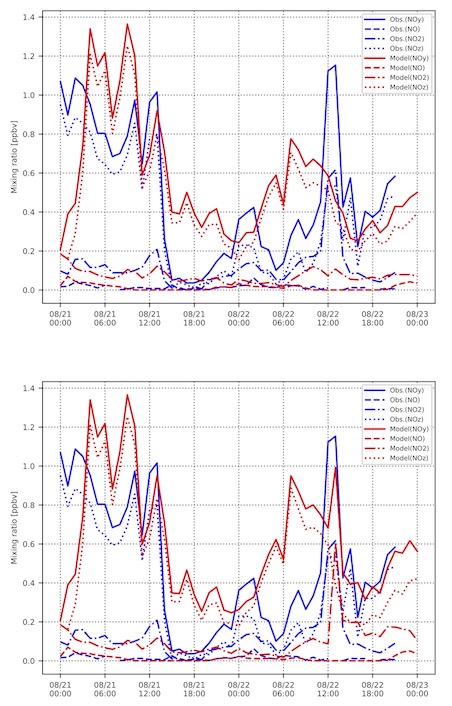
[Abstract] This study coupled a meteorological model with explicit bulk lightning and chemical transport models to investigate the impacts of lightning-induced nitrogen oxides (LNOx) on nitrogen monoxide (NO), nitrogen dioxide (NO2), and total reactive nitrogen oxide (NOy) measured on August 22, 2017, at the top of Mt. Fuji, Japan. Our simulation results indicated that the LNOx emitted around Wakasa Bay in the windward area of Mt. Fuji largely contributed to the NOy content measured at the top of Mt. Fuji. Furthermore, sensitivity experiments regarding the height of LNOx emissions indicated that the NOy content measured atop Mt. Fuji originated from LNOx emitted below 6 km. Our simulation assumed that a two-mode vertical distribution of LNOx emissions was more consistent with measured NOy at Mt. Fuji than a single-mode structure assumption in this case. A comparison of simulated NOx (= NO + NO2) and measured NOx at Mt. Fuji indicated that the reaction rates of the NO and NO2 cycles were well reproduced in our model; however, the ratio of NOz (NOy species other than NOx) to NOy estimated by the model were lower than the observed value, implying that the model either underestimated the reaction rate of LNOx or overestimated the wet removal of lightning-induced NOz. Finally, our results also suggest that the simultaneous observation of NOy and NOx is important for understanding LNOx emissions, subsequent atmospheric chemical reactions, and removal processes, as well as validating chemical transport models.
[Full Reference] Sato, Y., M. Kajino, S. Hayashi, R. Wada, 2023: A numerical study of lightning-induced NOx and formation of NOy observed at the summit of Mt. Fuji using an explicit bulk lightning and photochemistry model Atmos. Environ. X, 18 doi:10.1016/j.aeaoa.2023.100218
Development of a polar mesocyclone and associated environmental characteristics during the heavy snowfall event in Sapporo, Japan, in early February 2022. (Honda, 2023)
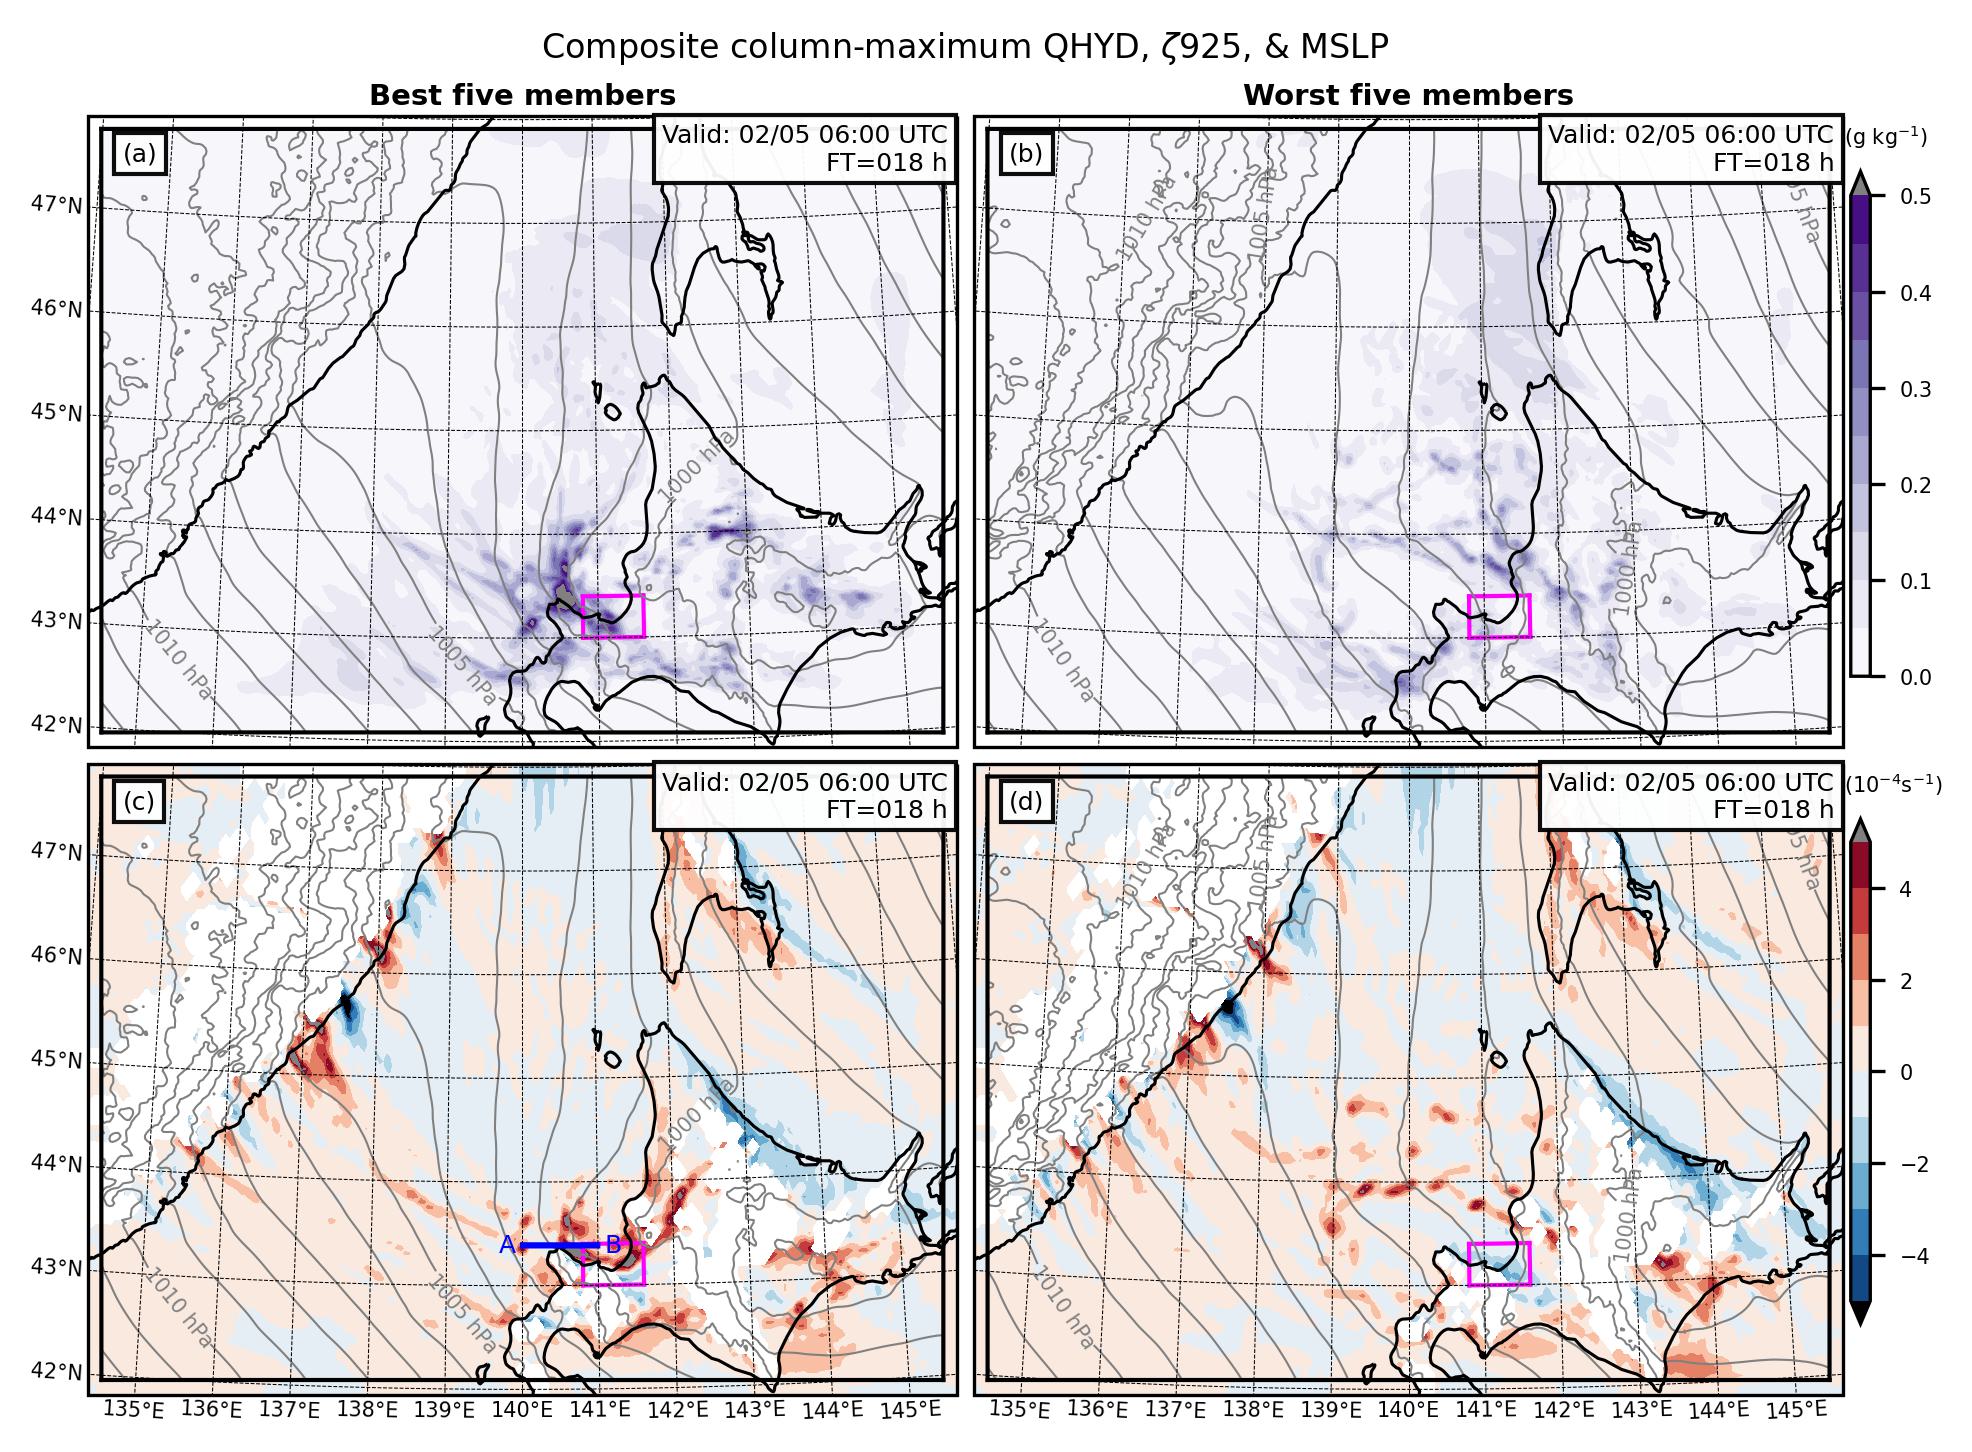
[Abstract] Heavy snowfalls have profound societal impacts; thus, their accurate prediction is important. In early February 2022, the Sapporo region (with approximately 2 million residents), north Japan, experienced record-breaking snowfall. This study investigates important processes during this snowfall event using a series of forecasts with small differences in the initial conditions. By comparing better and worse forecasts in terms of the amount of precipitation in the Sapporo region, this study indicates that a small rotating disturbance termed a polar mesocyclone (PMC) and an associated precipitation system resulted in heavy snowfall in the Sapporo region. The better members are characterized by environmental factors that are favorable for the development of PMCs. These factors are key to accurately predicting the heavy snowfall event in Sapporo.
[Full Reference] Honda, T., 2023: Development of a polar mesocyclone and associated environmental characteristics during the heavy snowfall event in Sapporo, Japan, in early February 2022. J. Geophys. Res. Atmos., 128 doi:10.1029/2022JD037774
Biases in Shortwave Three-Dimensional Radiative Transfer Calculations for High-Resolution Numerical Models (Hirata et al., 2023)
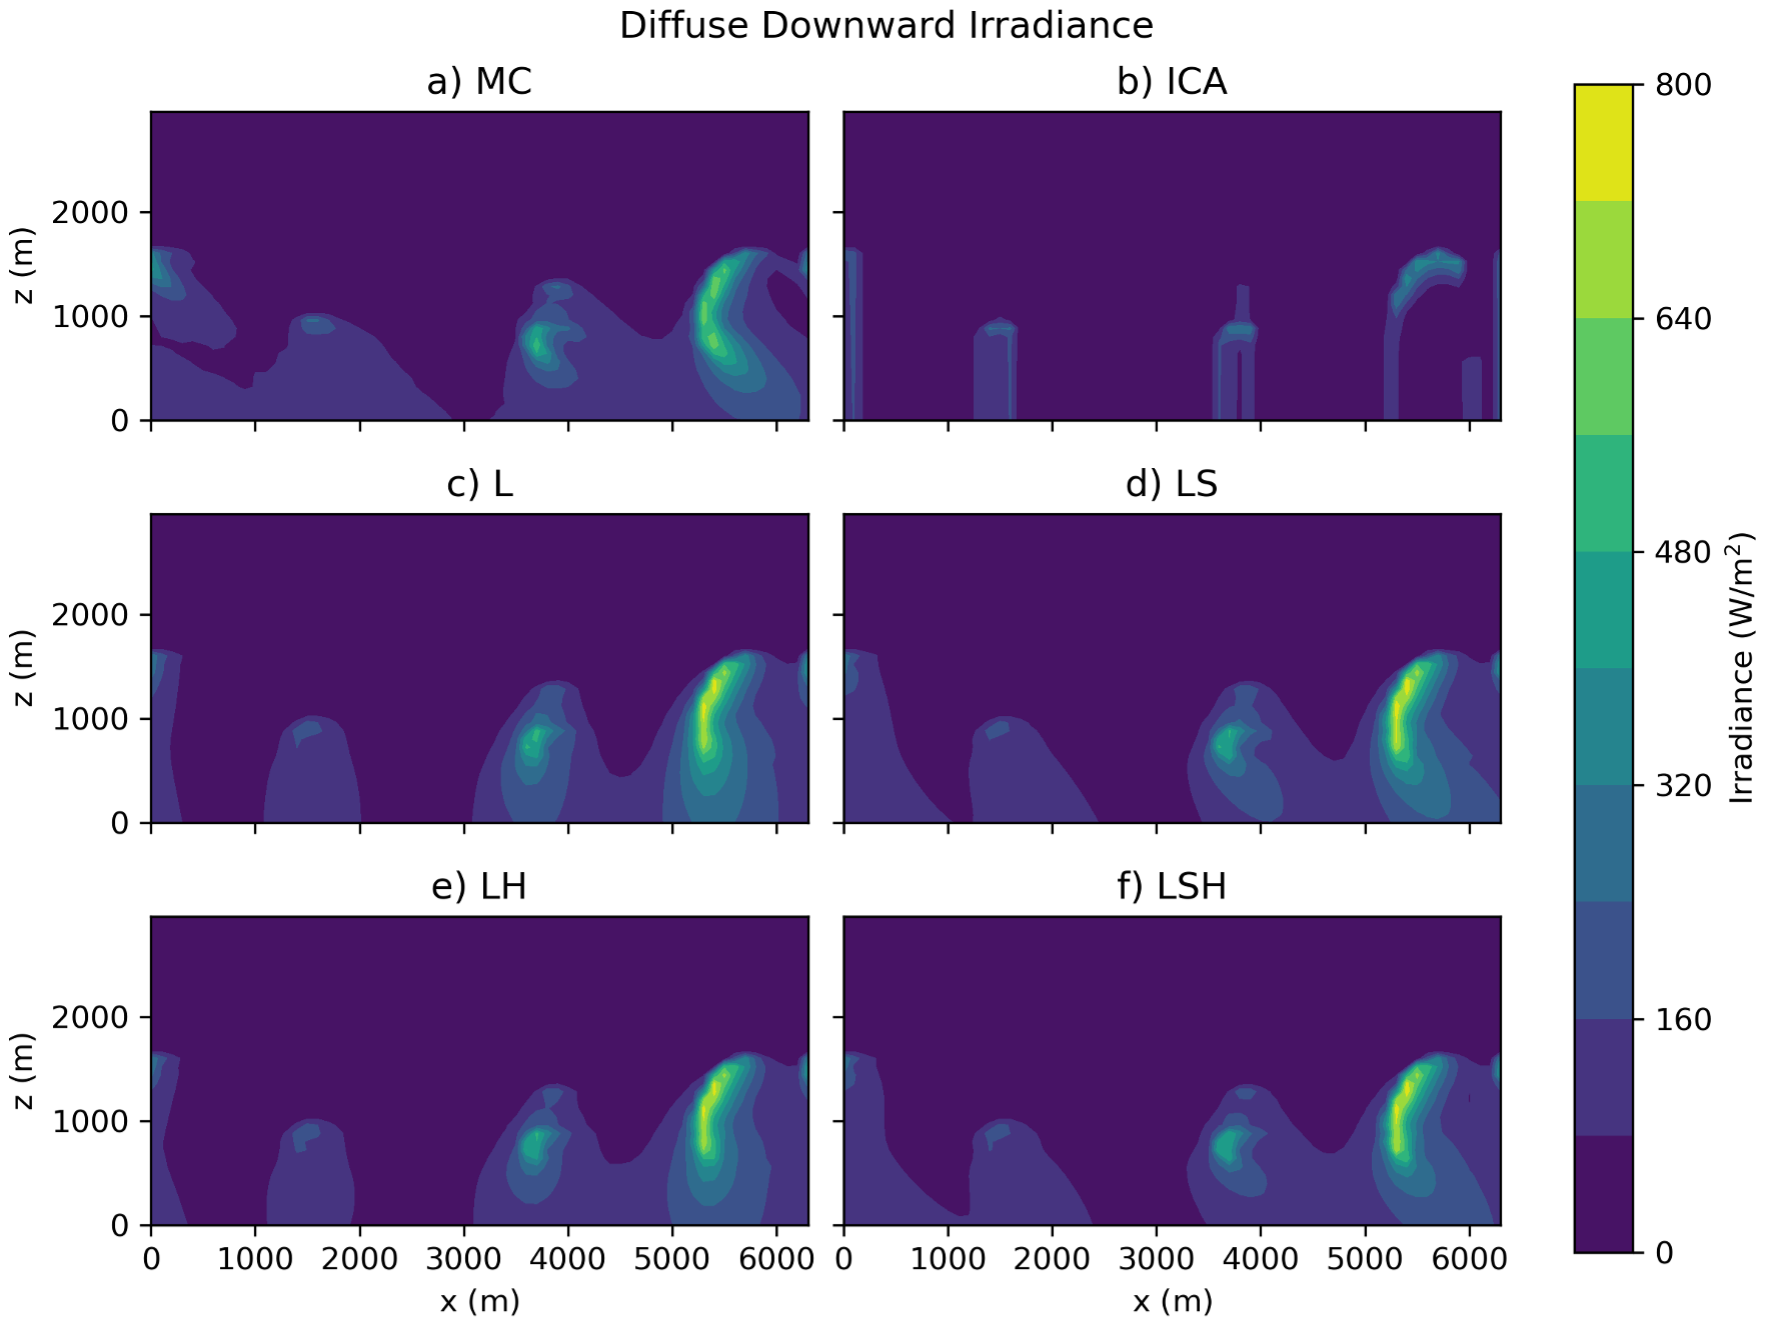
[Abstract] This study investigated biases of diffuse radiation in a look-up table approach, which pre-computed the sequential ray tracing to avoid heavy computation in full three-dimensional radiative transfer calculation. We introduced corrections that enhanced directionality of radiative propagation in the solar angle and horizontal direction. By comparing irradiance calculations with and without the corrections for cloudy field in an idealized atmospheric simulation, it was found that the corrections helped mitigate vertically localized false signals by diffuse irradiance. The results suggested that the two types of directionalities are important to accurately represent the three-dimensional transfer of diffuse radiation in an inhomogeneous atmosphere.
[Full Reference] Hirata, K., M. Sekiguchi, Y. Sato, and M. Inatsu 2023: Biases in Shortwave Three-Dimensional Radiative Transfer Calculations for High-Resolution Numerical Models SOLA, 19 50–56.
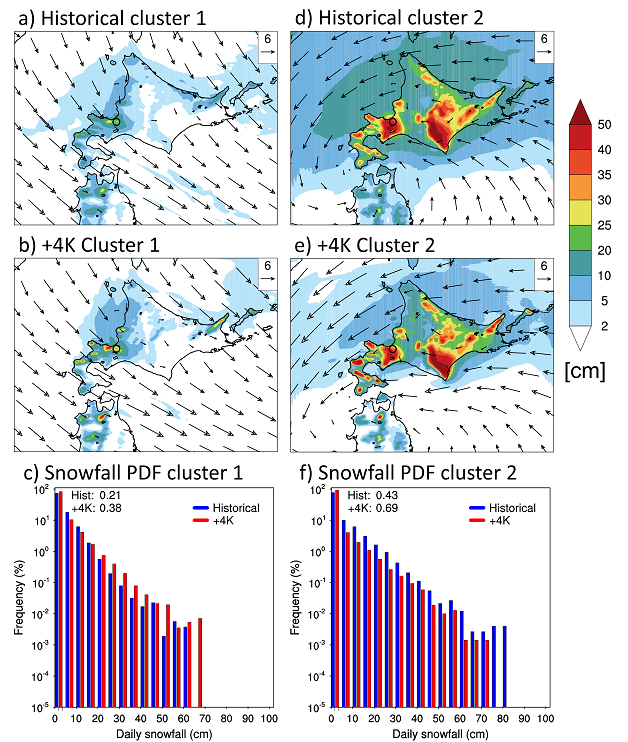
Future Changes in Tropical and Extratropical Cyclones Affecting Hokkaido and Their Related Precipitation Based on Large-Ensemble Climate Simulations. (Kawazoe et al., 2023)
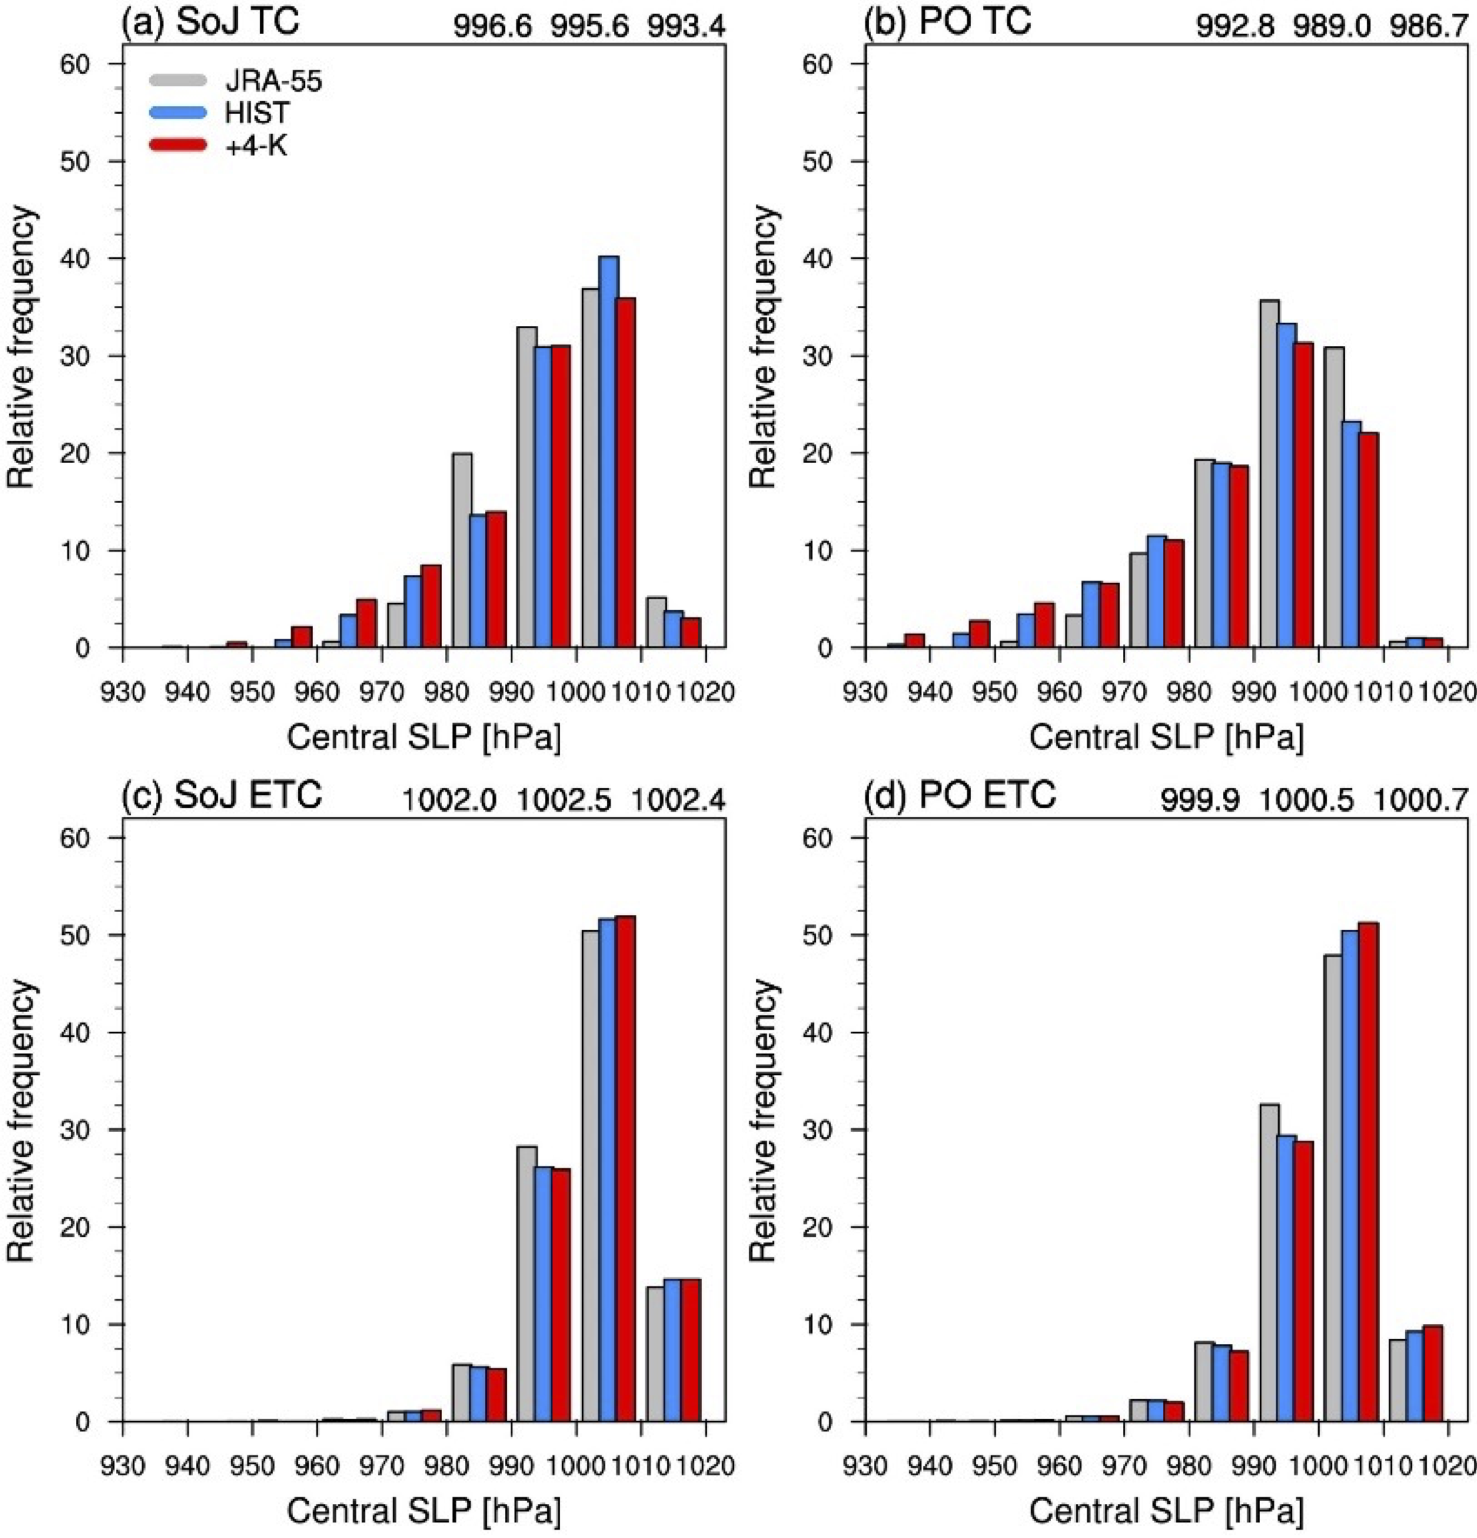
[Abstract] This study investigates the impact of future climate warming on tropical (TC) and extratropical cyclones (ETC) using the database for Policy Decision-making for Future climate change (d4PDF) large ensemble simulations. Cyclone tracking was performed using the Neighbor Enclosed Area Tracking algorithm (NEAT), and TC and ETCs were identified over the western North Pacific (WNP). For cyclone frequency, it was revealed that while a slight underestimation of the total number of TCs and ETCs in both the WNP and near Hokkaido, Japan, exists, the d4PDF reproduced the spatial distribution of both TC and ETC tracks well compared to observations/reanalysis. The 4-K warming scenarios derived from six different sea surface temperature warming patterns showed robust decreases in TC frequency in the tropical WNP and a slight reduction in ETCs near Japan. Next, precipitation characteristics for TCs or ETCs in the vicinity of Hokkaido were examined using 5 km-mesh regional climate ensemble simulations. Four representative cyclone locations near Hokkaido are identified using K-means clustering and revealed distinct precipitation characteristics between clusters, with higher TC-associated precipitation than ETC-associated precipitation and the heaviest precipitation in the southern portion of the prefecture. The 4-K warming scenarios revealed increased precipitation for all cyclone placements for both TCs and ETCs. Lastly, average cyclone intensity, translation speed, and size were examined. It was shown that TCs in future climates are more intense, propagate more slowly, and are smaller in terms of enclosed vorticity area as they approach Hokkaido. For ETCs, mean intensity does not change much, they travel slightly faster, and become smaller.
[Full Reference] Kawazoe, S., M. Inatsu, T.J. Yamada, and T. Hoshino, 2023: Future changes in tropical and extratropical cyclones affecting Hokkaido and their related precipitation based on large-ensemble climate simulations. Journal of Applied Meteorology and Climatology, 62 341–359.
Research topics published in 2022.
Predictability of heavy snowfall days in western Hokkaido from JMA Operational 1-Month Ensemble Predictions using self-organizing maps.(Kawazoe and Inatsu, 2022)
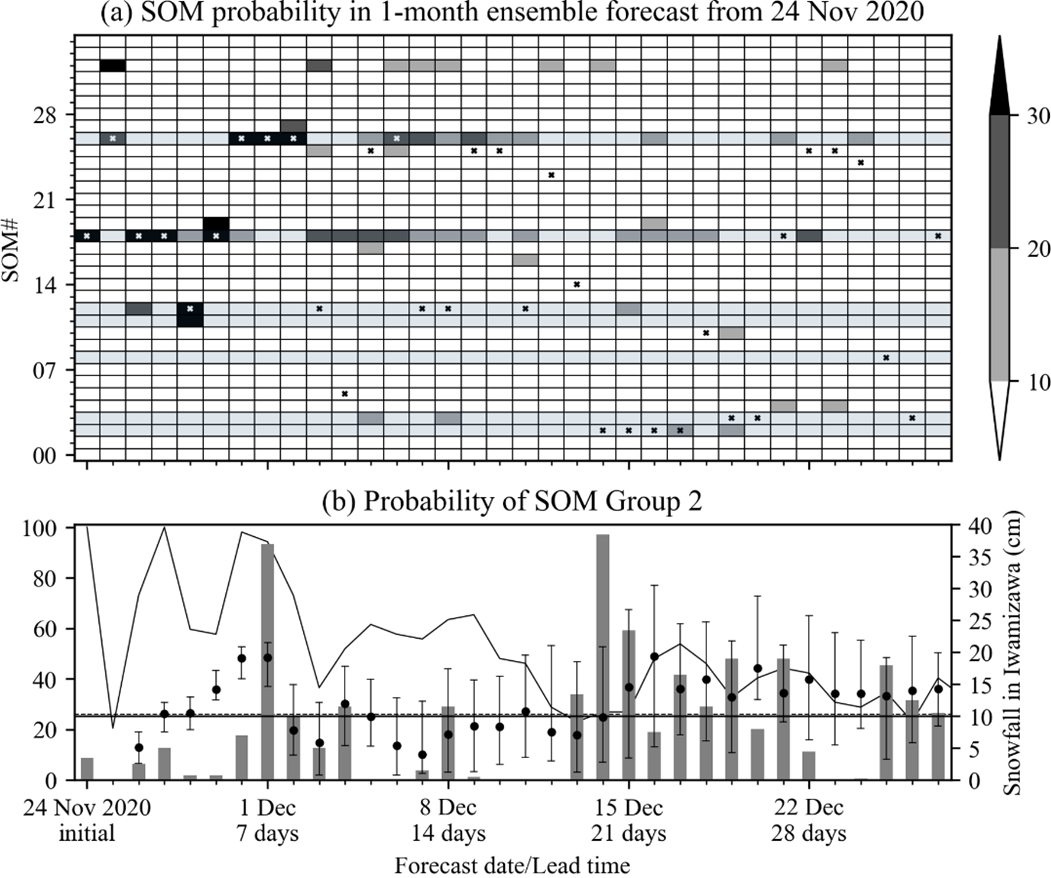
[Abstract] We investigated the sub-seasonal predictability of heavy snowfall events in Iwamizawa, Hokkaido, using the Japan Meteorological Agency’s 1-month ensemble predictions. First, the self-organizing map (SOM) technique was applied to the Japanese 55-year Reanalysis sea-level pressure anomalies to identify weather patterns resulting in heavy snowfall. It revealed that heavy snowfall developed in SOM nodes (weather patterns) with low-pressure centers to the east/northeast of Hokkaido and Siberian high to the west, resulting in westerly to northwesterly monsoon winds traversing the Sea of Japan towards western Hokkaido. Next, ensemble forecasts were projected onto the SOM map to determine the predictability of weather patterns up to a month in advance. For winter 2019, there was Kawazoe et al., Predictability of heavy snowfall days in western Hokkaido relatively low probability of projecting a high number of ensembles in SOM nodes to those observed in the reanalysis. In contrast, much higher probability was seen in 2020 to ~10 forecast days. When considering multiple SOM nodes that contribute to heavy snowfall in the forecast, both winters saw more ensemble members predicting heavy snowfall to ~10 forecast days. We also saw a higher probability of heavy snowfall beyond 10-days in 2020. These results highlight the potential benefit of incorporating multiple weather patterns to forecast heavy snowfall.
[Full Reference] Kawazoe, S., and M. Inatsu, 2022: Predictability of heavy snowfall days in western Hokkaido from JMA Operational 1-Month Ensemble Predictions using self-organizing maps. Scientific Online Letters on the Atmosphere, 18, 147–153.
Research topics published in 2021.
Summertime precipitation in Hokkaido and Kyushu, Japan in response to global warming (Takabatake and Inatsu 2021)
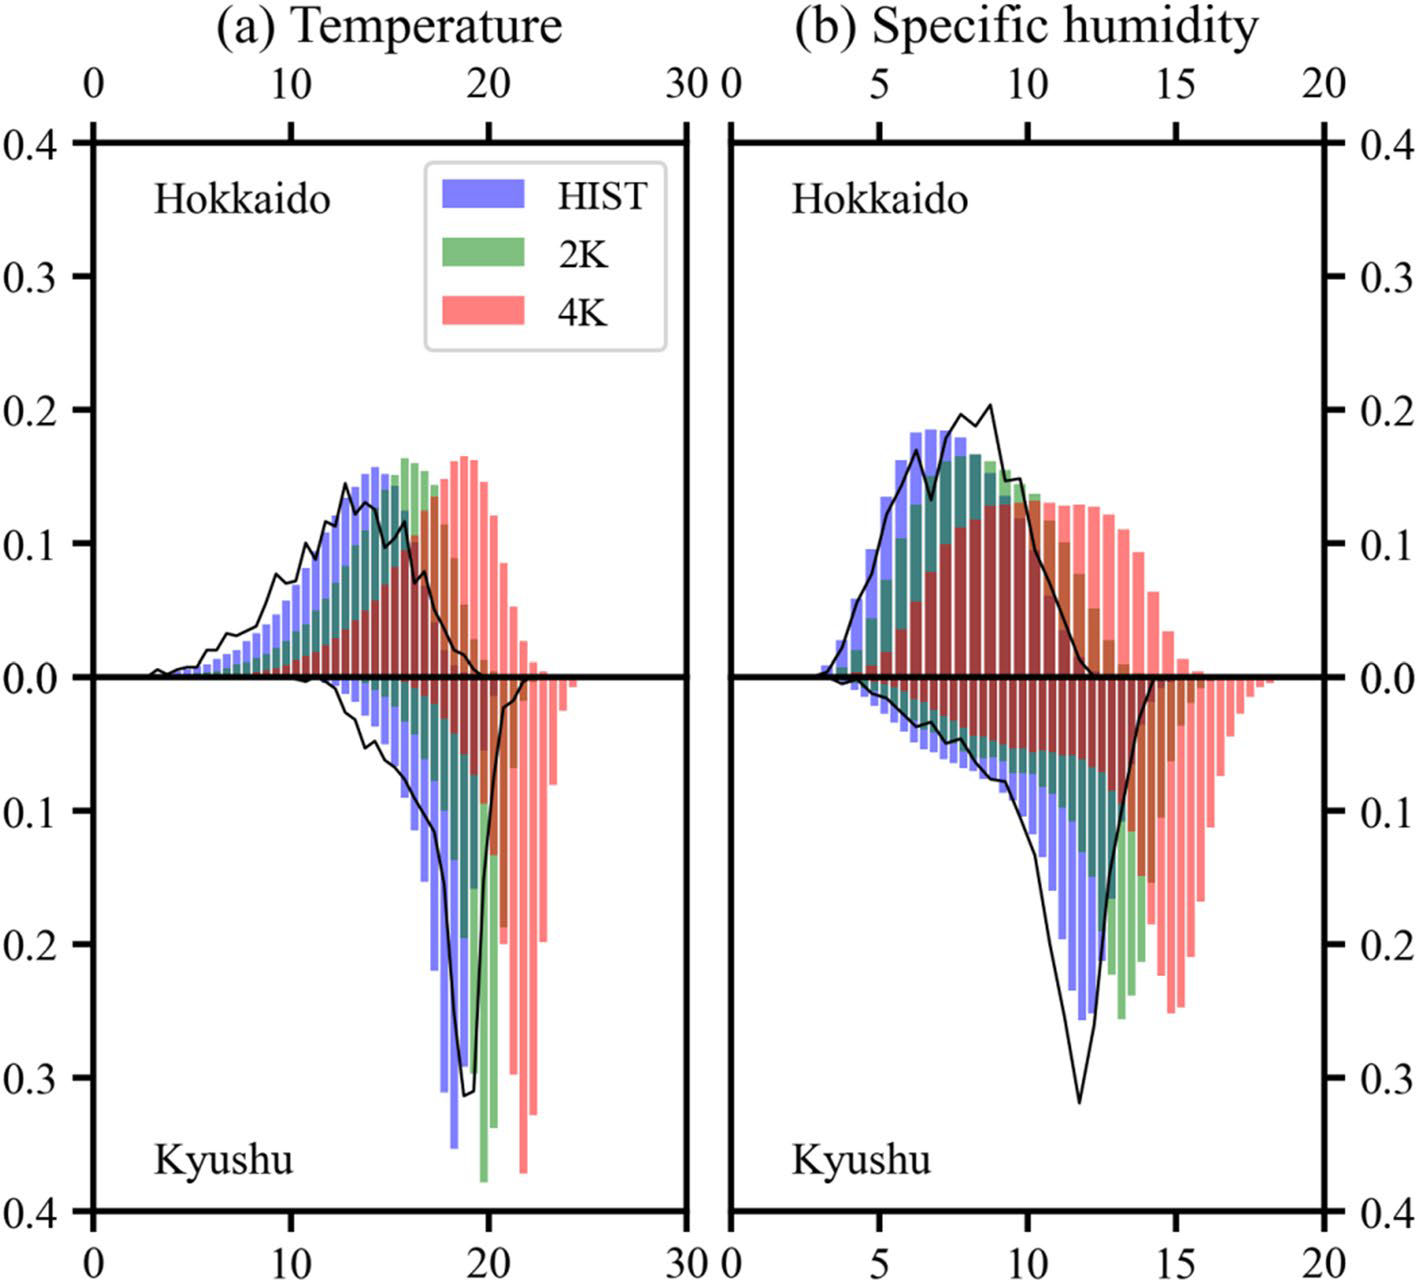
[Abstract] We analyzed a large ensemble dataset called the database for Policy Decision Making for Future climate change (d4PDF), which contains 60-km resolution atmospheric general circulation model output and 20-km resolution dynamical downscaling for the Japanese domain. The increase in moisture and precipitation, and their global warming response in June–July–August were described focusing on the differences between Hokkaido and Kyushu; Hokkaido is cool and dry and Kyushu is hot and humid in the current climate. The results suggested that the specific humidity increased almost following the Clausius Clapeyron relation, but the change in stationary circulation suppressed the precipitation increase, except for in western Kyushu. The + 4 K climate in Hokkaido would be as hot and humid as the present climate in Kyushu (Figure). The circulation change related to the southward shift of the jet stream and an eastward shift of the Bonin high weakened the moisture flux convergence via a stationary field over central Japan including eastern Kyushu. The transient eddy activity counteracted the increase in humidity, so that the moisture flux convergence and precipitation did not change much over Hokkaido. Because the contribution of tropical cyclones to the total precipitation was at most 10%, the decrease in the number of tropical cyclones did not explain the predicted change in precipitation.
[Full Reference] Takabatake, D., and M. Inatsu, 2021: Summertime precipitation in Hokkaido and Kyushu, Japan in response to global warming. Climate Dynamics, 58 1671–1682
Trends and projection of heavy snowfall in Hokkaido, Japan as an application of self-organizing map (Inatsu et al. 2021)
[Abstract] This paper showed the frequency of local-scale heavy winter snowfall in Hokkaido, Japan, its historical change, and its response to global warming using self-organizing maps (SOM) of synoptic-scale sea level pressure anomaly. Heavy snowfall days were here defined as days on which the snowfall exceeded 10 mm in water equivalent. It was shown that the SOMs can be grouped into three categories for heavy snowfall days: 1) a passage of extratropical cyclones to the south of Hokkaido, 2) a pressure pattern between the Siberian high and the Aleutian low, and 3) a low pressure anomaly just to the east of Hokkaido. Groups 1 and 2 were associated with heavy snowfall in Hiroo (located in southeastern Hokkaido) and in Iwamizawa (western Hokkaido), respectively, and heavy snowfall in Sapporo (western Hokkaido) was related to group 3. The large-ensemble historical simulation reproduced the observed increasing trend in group 2, and future projections revealed that group 2 was related to a negative phase of the western Pacific pattern and that the frequency of this group would increase in the future. Heavy snowfall days associated with SOM group 2 would also increase as a result of the increase in water vapor and preferable weather patterns in a globally warming climate, in contrast to the decrease of heavy snowfall days at other sites associated with SOM group 1.
[Full Reference] Inatsu, M., S. Kawazoe, and M. Mori, 2021: Trends and projection of heavy snowfall in Hokkaido, Japan as an application of self-organizing map. Journal of Applied Meteorology and Climatology, 60, 1483–1494.
Development of snowdrift model with the Lattice Boltzmann Method (Tanji et al. 2021)
[Abstract] We developed a snowdrift model to evaluate the snowdrift height around snow fences, which are often installed along roads in snowy, windy locations. The model consisted of the conventional computational fluid dynamics solver that used the lattice Boltzmann method and a module for calculating the snow particles’ motion and accumulation. The calculation domain was a half channel with a flat free-slip boundary on the top and a non-slip boundary on the bottom, and an inflow with artificially generated turbulence from one side to the outlet side was imposed. In addition to the reference experiment with no fence, experiments were set up with a two-dimensional and a three-dimensional fence normal to the dominant wind direction in the channel center. The estimated wind flow over the two-dimensional fence was characterized by a swirling eddy in the cross section, whereas the wind flow in the three-dimensional fence experiment was horizontally diffluent with a dipole vortex pair on the leeward side of the fence. Almost all the snowdrift formed on the windward side of the two-dimensional and three-dimensional fences, although the snowdrift also formed along the split streaks on the leeward side of the three-dimensional fence. Our results suggested that the fence should be as long as possible to avoid snowdrifts on roads.
[Full Reference] Tanji, S., M. Inatsu, and T. Okaze, 2021: Development of snowdrift model with the Lattice Boltzmann Method. Progress in Earth and Planetary Science, 8, 57, doi:10.1186/s40645-021-00449-0
Difference in the lightning frequency between the July 2018 heavy rainfall event over central Japan and the 2017 northern Kyushu heavy rainfall event in Japan (Sato et al. 2021b)
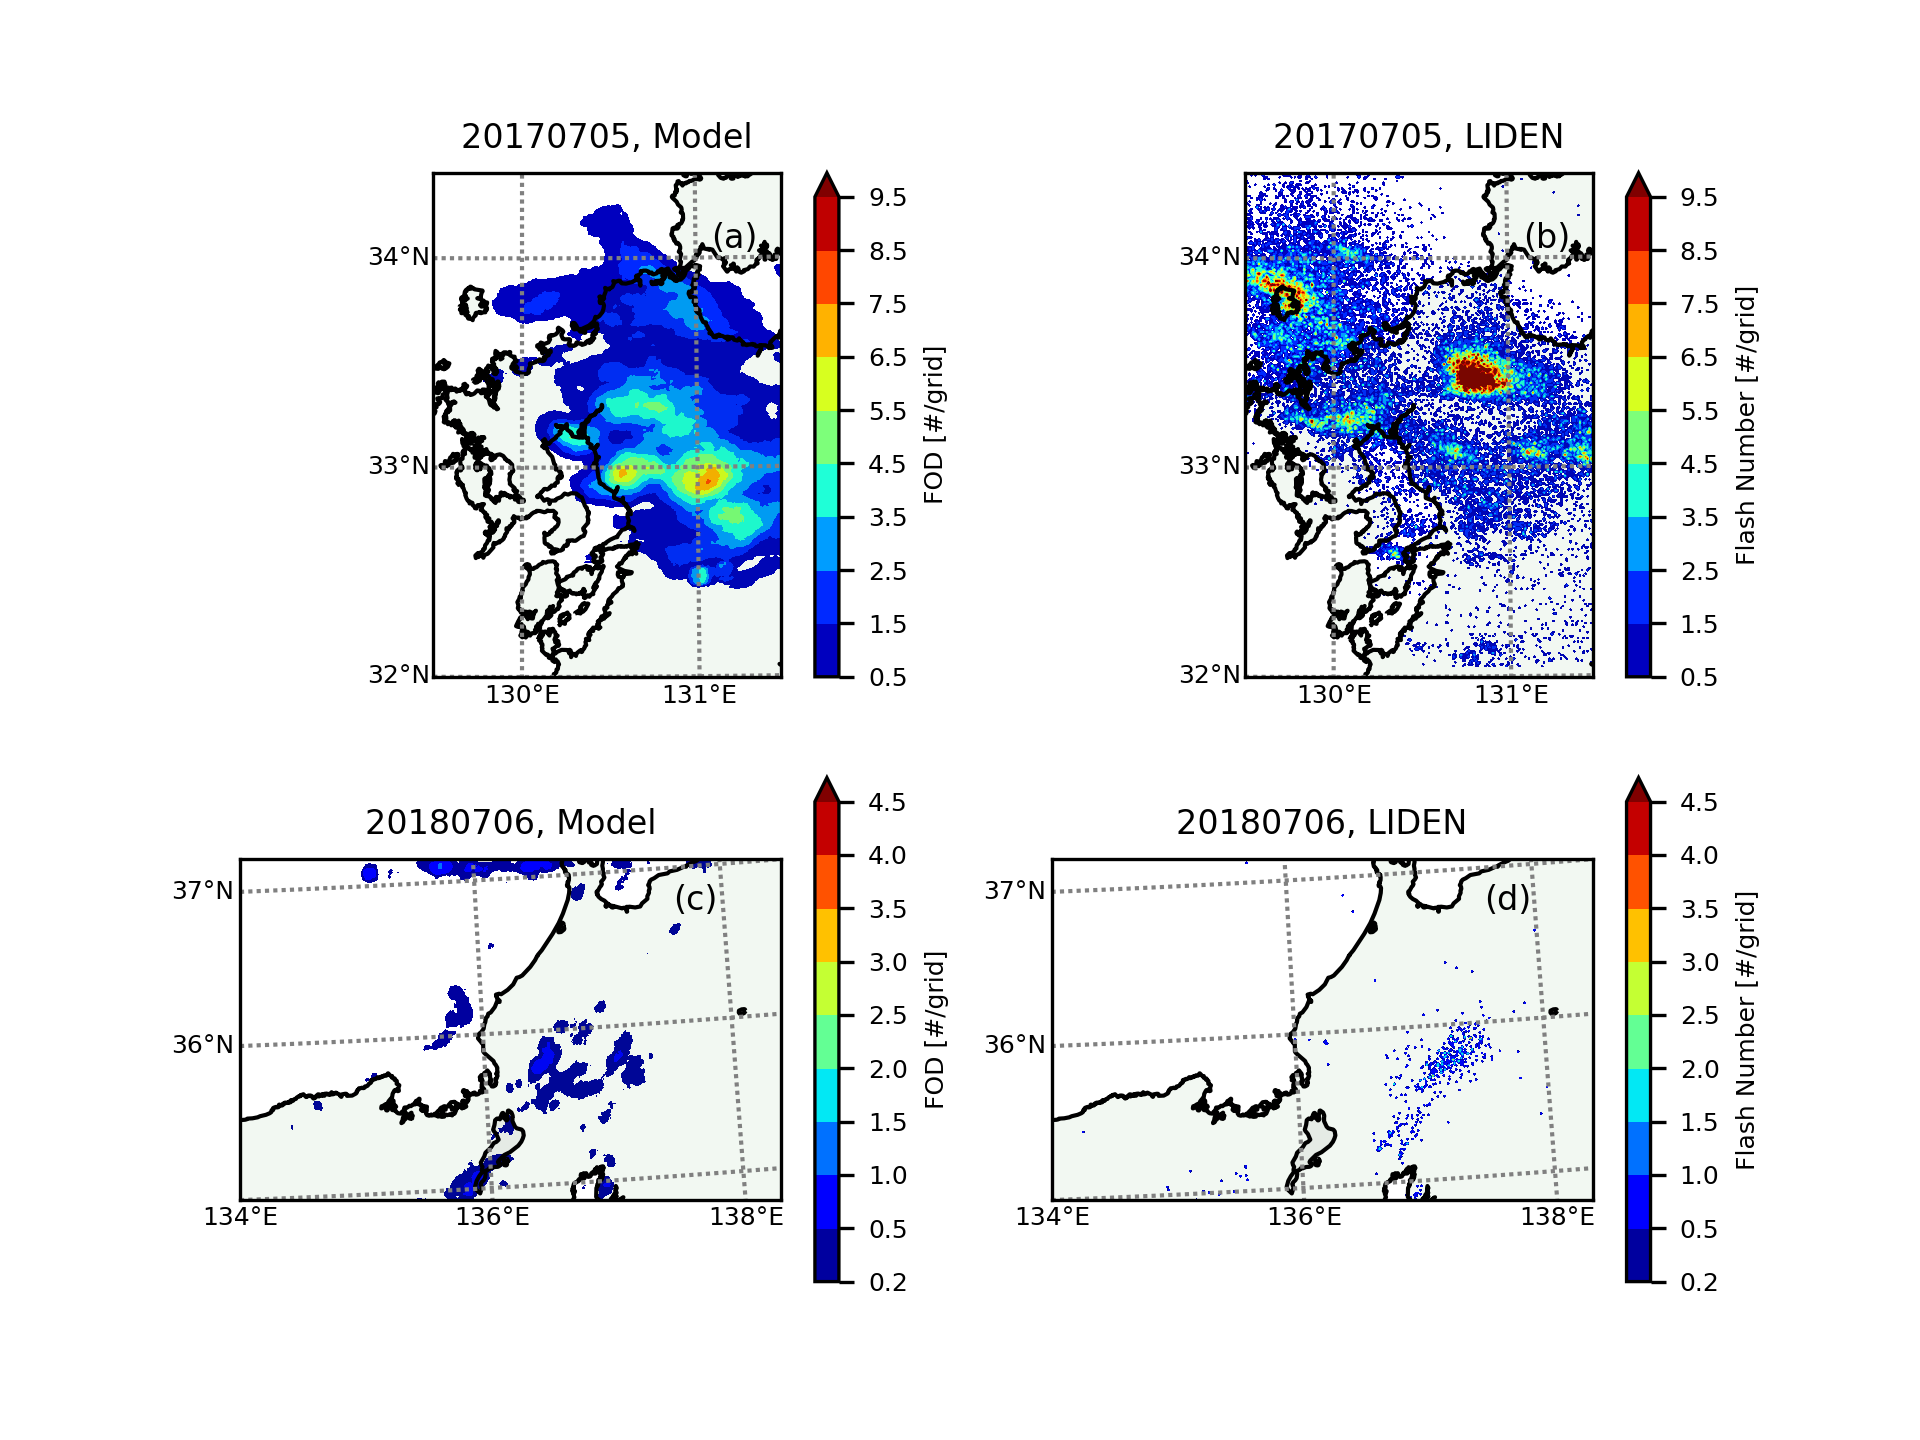
[Abstract] The causes for the differences in the lightning frequency between two heavy rainfall events, the 2017 northern Kyushu heavy rainfall event and the 2018 heavy rainfall event in central Japan, were examined using a numerical model coupled with an explicit bulk lightning model. These heavy rainfall events occurred near the Baiu frontal system of Japan in July, but the characteristics of rainfall differed. The former case was categorised as an extreme rainfall and extreme convective event by previous satellite observational studies, and the lightning frequency was high. Conversely, the latter case was categorised as an extreme rainfall without extreme convection event, and the lightning frequency was low. The numerical model used in this study successfully reproduced the differences in the lightning frequency between the two cases. Our analyses indicated that the differences in the lightning frequency between the two cases were attributed to the differences in the vertical structure of the charge separation rate and the charge density, which originated from the difference in the vertical distribution of graupel.
[Full Reference] Sato, Y., S. Hayashi, and A. Hashimoto, 2021: Difference in the lightning frequency between the July 2018 heavy rainfall event over central Japan and the 2017 northern Kyushu heavy rainfall event in Japan Atmospheric Science Letters, 23(1), e1067, doi:10.1002/asl.1067.
Evaluation of cloud microphysical schemes for winter snowfall events in Hokkaido: A case study of snowfall by winter monsoon (Kondo et al. 2021)
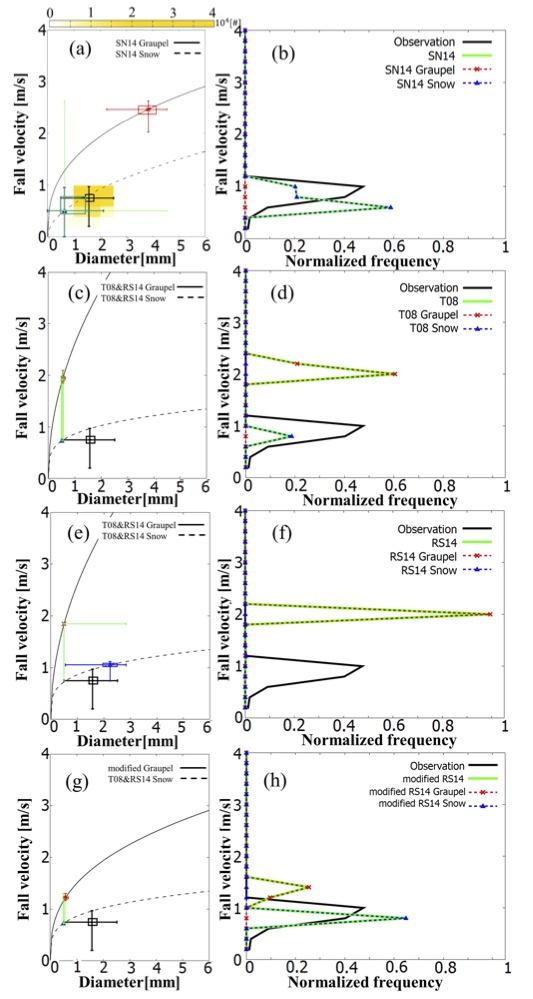
[Abstract] The performances of bulk microphysical schemes were evaluated through comparisons with observations, including a new volume scanning video disdrometer targeting one of a typical snowfall event in Hokkaido, Japan. For the evaluation, downscaling experiments using three bulk microphysical schemes were conducted: a two-moment bulk scheme, a one-moment bulk scheme, and an improved version of the one-moment bulk scheme coupled with an identical dynamical core. The two-moment scheme successfully simulated the measured relationship between particle size and terminal velocity distribution (PSVD). On the other hand, the one-moment scheme overestimated the graupel frequency, its terminal velocity, and underestimated the particle diameter. The improved version of the one-moment bulk scheme reduced the overestimation of the terminal velocity of hydrome- teors, but still overestimated the graupel frequency. We improved the overestimation of terminal velocity and the frequency of graupel in the one-moment scheme by modifying the assumption of the velocity–diameter relationship and the intercept parameter of the size distribution of graupel based on the results of the new disdrometeor. The observation of the new disdrometer would give us hints to improve the microphysics schemes in snowfall cases.
[Full reference] Kondo, M., Y. Sato, M. Inatsu, and Y. Katsuyama, 2021: Evaluation of Cloud Microphysical Schemes for Winter Snowfall Events in Hokkaido: A Case Study of Snowfall by Winter Monsoon Scientific Online Letters on the Atmosphere, 17, 74–80.
Lightning frequency in an Idealized Hurricane-like Vortex. (Sato et al. 2021)
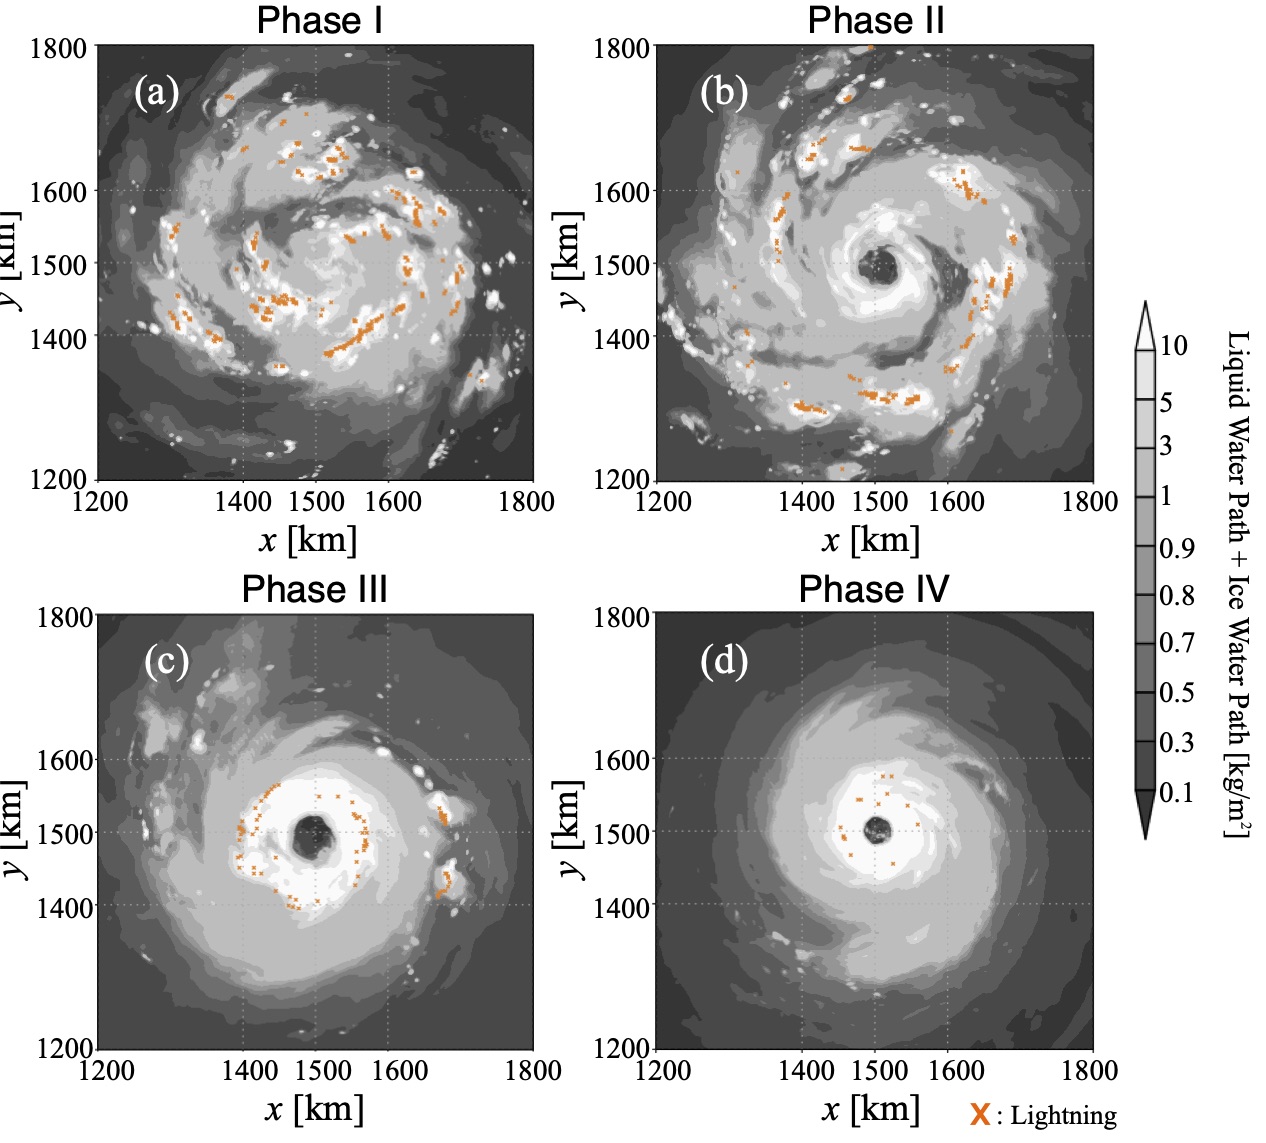
[Abstract] The dependence of lightning frequency on the life cycle of an idealized tropical cyclone (TC) was investi-gated using a three-dimensional meteorological model coupled with an explicit lightning model. To investigate this de-pendence, an idealized numerical simulation covering the initial state to the steady state (SS) of an idealized TC wasconducted. The simulation was consistent with the temporal evolution of lightning frequency reported by previous ob-servational studies. Our analyses showed that the dependence originates from changes in the types of convective cloud withlightning over the life cycle of the TC. Before rapid intensification (RI) and in the early stage of RI, convective cloud cellsthat form under high-convective available potential energy (CAPE) conditions are the main contributors to lightning. Asthe TC reaches the late stage of RI and approaches SS, the secondary circulation becomes prominent and convective cloudsin the eyewall region alongside the secondary circulation gradually become the main contributors to the lightning. In theconvective cloud cells formed under high-CAPE conditions, upward velocity is strong and large charge density is providedthrough noninductive charge separation induced by graupel collisions. This large charge density frequently induces light-ning in the clouds. On the other hand, the vertical velocity in the eyewall is weak, and it tends to contribute to lightning onlywhen the TC reaches the mature stage. Our analyses imply that the maximum lightning frequency that occurs before themaximum intensity of a TC corresponds to the stage of a TC’s life cycle in which convective cloud cells are generated mostfrequently and moisten the upper troposphere.
[Full reference] Sato, Y., Y. Miyamoto, and H. Tomita, 2021: Lightning Frequency in an Idealized Hurricane-Like Vortex from Initial to Steady-State Using a Coupled Meteorological and Explicit Bulk Lightning Model. Monthly Weather Review, 149, 753–771.
Advantage of volume scanning video disdrometer in solid-precipitation observation. (Katsuyama and Inatsu 2021)
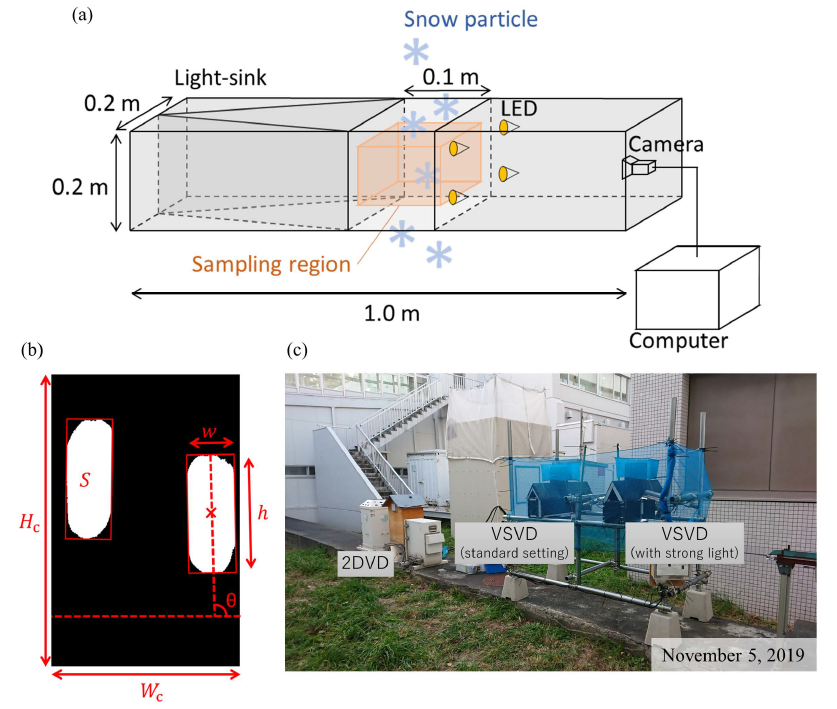
[Abstract] This study developed a volume scan-type disdrometer and investigated the size distribution of solid-precipitation particles observed by flux- and volume-scan type disdrometers, installed in 2016–2017 winter in Sapporo, Japan. The former disdrometer detected particles, by line sensors, of which frequency is proportional to the particle number per area. On the other hand, the latter directly observed the particle number per volume using an image sensor. The flux-scan data are known to have the bias of more frequency in higher-speed (or larger-size) particles, but this bias was hardly corrected due to the error of estimated particles’ velocity. It was first validated that the volume scan-type disdrometer could observe particle size between 0.5 mm and 13 mm, consistently with the flux scan-type one. Then, we examined how many events showed the difference of the size distribution between the two disdrometers with the Kolmogorov-Smirnov test. The result showed that 84% of the total events examined fell into the class where they were significantly different, partially due to fast-falling graupels.
[Full reference] Katsuyama, Y., and M. Inatsu, 2021: Advantage of volume scanning video disdrometer in solid-precipitation observation. Scientific Online Letters on the Atmosphere, 17, 35–40.
Risk Assessment and Possible Adaptation of Potato Production in Hokkaido to Climate Change Using a Large Number Ensemble Climate Dataset d4PDF (Sugawara et al. 2021)
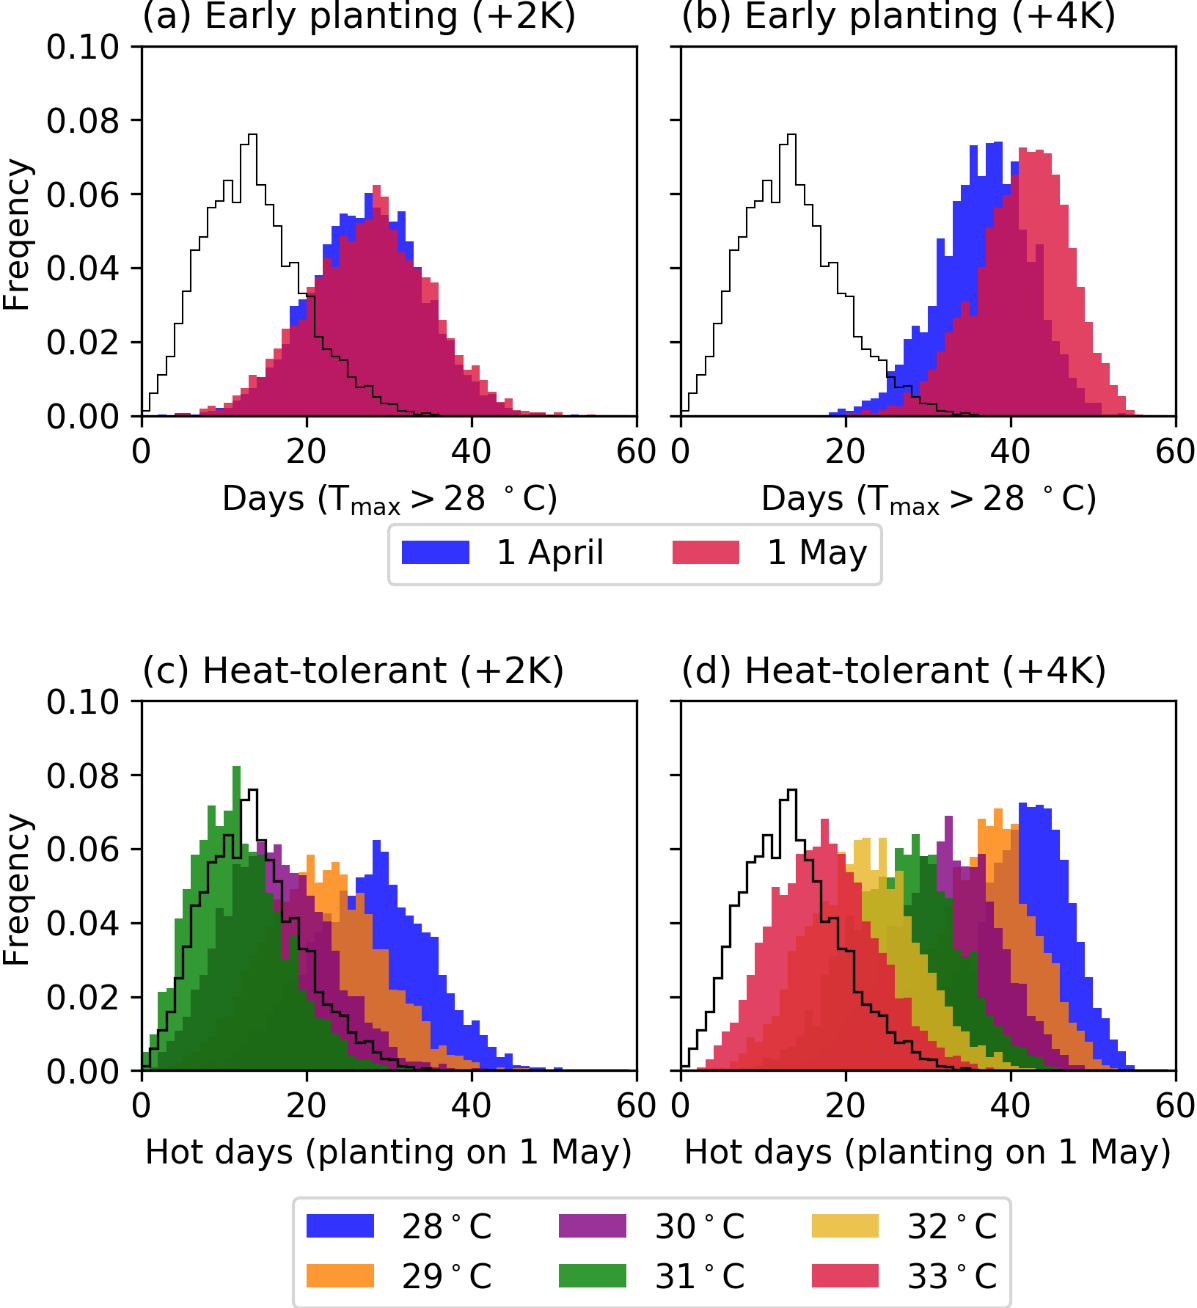
[Abstract] While global warming may expand suitable places for potato cultivation in cold regions, it may reduce the yield due to the increase of hot days during the tuber growth period. This study evaluated the effects of global warming on potato cultivation over Hokkaido by dynamically-downscaled ensemble experiments called d4PDF and assessed applicability of possible adaptive measures. In this study, we define the suitable area based on the accumulated temperature and deduced a relationship between the potato yield per unit area and the number of hot days (maximum temperature > 28℃) from crop statistic data. In a warming environment with 2K or 4K increase in global-mean temperature relative to the present climate (1981-2010), the accumulated temperatures likely satisfied the criterion on potato production almost over Hokkaido. The risk of growth delay due to cold weather was projected to reduce. However, hot days in the tuber growth period would increase, reducing potato yield by 7% in a plus 2-K climate and 16% in a plus 4-K climate. This risk of yield loss would not be avoidable by moving up planting by 30 days, and the development of varieties that are tolerant to 31-33℃ would be a possible way to adaptation.
[Full reference] Sugawara, K., M. Inatsu, S. Shimoda, K, Murakami, and T. Hirota, 2021: Risk assessment and possible adaptation of potato production in Hokkaido to climate change using a large number ensemble climate dataset d4PDF. Scientific Online Letters on the Atmosphere, 17,24–29.
A high-resolution prediction system for birch pollen in Sapporo (Inatsu et al. 2021a)
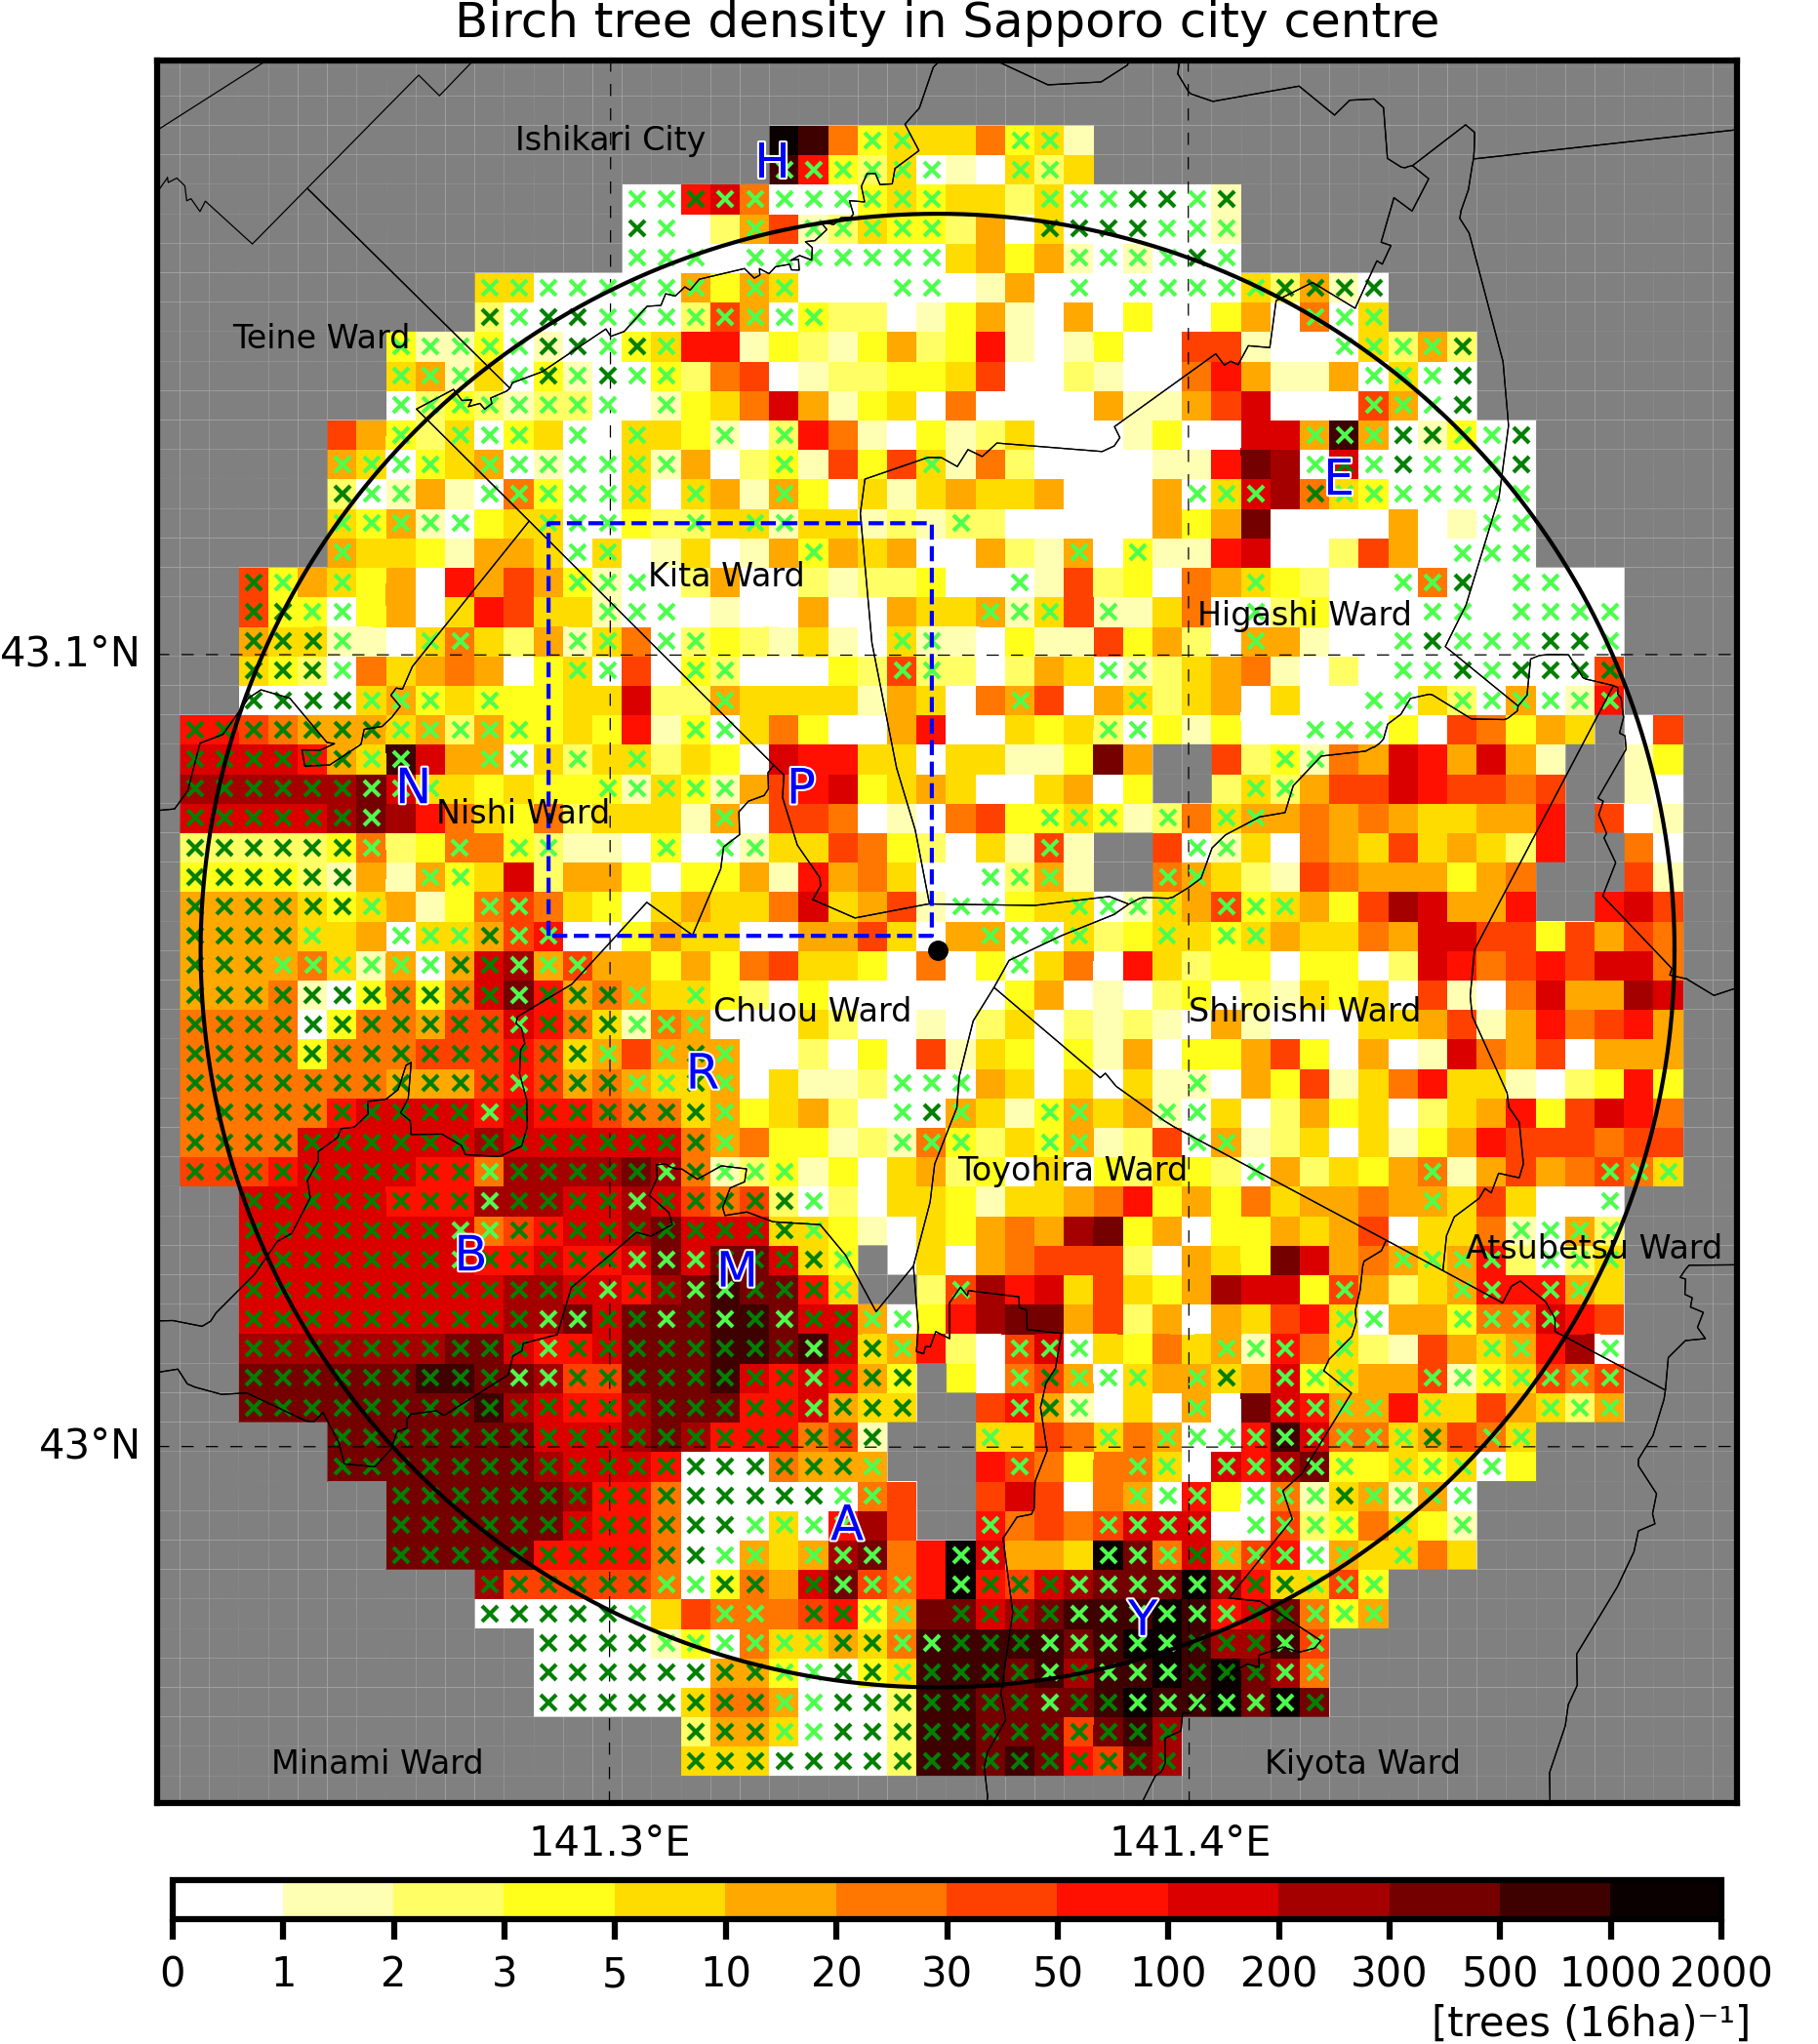
[Abstract] This study aims to develop a high-resolution forecast model for airborne birch pollen concentration in Sapporo. Using results that shows that the bulk of pollen grains was deposited near the source plant, we created a high-resolution birch tree density map from a field survey along public roads and footpaths and Street View on Google Maps. The map was linearly extrapolated to cover an area 10 km from the city centre, including forests in the south and southwest. A new atmospheric dispersion deposition model for birch pollen was developed to represent wind advection, turbulent mixing, and convection in the atmospheric boundary layer, and gravitational settling and scavenging with precipitation. Pollen emission was also modelled as a function of the birch tree density and surface air temperatures. The onset of the pollen season was based on the pollen observations by a sampler at Hokkaido Institute of Public Health in Sapporo, and the end of pollen season was assumed to be 40 days after its onset. Comparison with observations suggested that the hindcast simulation with the model reproduced the daily variations in the dry deposition well in most years from 2001 to 2011. The geographical distribution of birch pollen deposition was highly correlated with the birch tree density map, even on windy days.
[Full reference] Inatsu, M., R. Yoshida, S. Karino, S. Takeuchi, and S. Kobayashi, 2021: A high-resolution prediction system for birch pollen in Sapporo. Agricultural and Forest Meteorology, 29, 108229.
Research topics published in 2020.
Climate change impacts on heavy snowfall in Sapporo using 5-km mesh large ensemble simulations (Kawazoe et al. 2020)
[Abstract] Synoptic circulation patterns associated with heavy snowfall events in Sapporo are examined using large ensemble simulation with 60-km global climate experiments. For snowfall, a 5-km dynamically downscaled model from the 20-km regional simulation is utilized. To identify synoptic circulation patterns, self-organizing maps (SOMs) are applied, and their response to a warming climate is examined. The authors find that heavy snow events predominantly occur due to low pressure anomalies to the north/east of Hokkaido or over central Japan, and by high pressure anomalies over the Siberian continent. The 4 K warming climate shows robust decreases in heavy snowfall amounts associated with low pressure anomalies over central Japan and increases in heavy snowfall amounts under patterns with high pressure anomalies over Siberia. This is attributed to surface air temperature characteristics in future climates, as precipitation in the former with surface winds transporting warm, moist air from the south and east, develops predominantly above 0℃ in the +4 K climate, while the latter, often resulting in intense snow band events, continues to be dominated by temperatures near or below zero.
[Full reference] Kawazoe, S., M. Inatsu, T.J Yamada, and T. Hoshino, 2020: Climate change impacts on heavy snowfall in Sapporo using 5-km mesh large ensemble simulations. Scientific Online Letters on the Atmosphere, 16, 233–239.
Toward predicting expressway closures due to blowing snow events. (Inatsu et al. 2020)
[Abstract] This study aimed to improve the estimation of blowing snow events for predicting expressway closures. The Japan Meteorological Agency mesoscale model analysis with a grid resolution of 5 km was dynamically downscaled to 1 km using the SCALE meteorological model in the domain including Hokkaido, Japan, in the period from 1 November 2017 to 28 February 2018. This study focused on the E5 expressway, run by East Nippon Expressway Co., Ltd., in Hokkaido, where closures frequently occur as a result of low visibility due to blowing snow in winter. The blowing snow potential was evaluated in terms of the minimum driver visibility estimated by an empirical relation among wind speed, air temperature, and snowfall intensity. Because the downscaling overestimated wind speed, a simple bias correction was applied. The downscaling produced small-scale snow cloud streaks that led to blowing snow, although snowfall spots were often mispositioned. In contrast, the mesoscale model analysis did not produce such small-scale phenomena, and thus the blowing snow potential matched closures only when the snowfall was caused by synoptic-scale disturbances.
[Full reference] Inatsu, M., S. Tanji, and Y. Sato, 2020: Toward predicting expressway closures due to blowing snow events. Cold Region Science and Technology, 177, 103–123.
A model intercomparison of atmospheric 137Cs concentrations from the Fukushima Daiichi Nuclear Power Plant accident, Phase III: Simulation with an identical source term and meteorological field at 1-km resolution. (Sato et al. 2020)
[Abstract] The third model intercomparison project (MIP) for investigating the atmospheric behavior of atmospheric caesium-137 (137Cs) emitted from Fukushima Daiichi Nuclear Power Plant (FDNPP) (3rd FDNPP-MIP), Japan, in March 2011, was conducted. A finer horizontal grid spacing (1 km) was used than in the previous FDNPP-MIP (2nd FDNPP-MIP, Sato et al., 2018; 3 km) to evaluate the models’ performance for high-concentration events measured near FDNPP. Nine of the models used in the 2nd FDNPP-MIP were also used in the 3rd FDNPP-MIP, and all models used identical source terms and meteorological fields. The performance of the models was evaluated through a comparison with observational data. Our analyses indicated that most of the observed high atmospheric 137Cs concentrations (plumes) were reasonably well simulated by the models, and the good performance of some models improved the performance of the multimodel, highlighting the advantage of using a multimodel ensemble.
[Full reference] Sato, Y., T. T. Sekiyama, S. Fang, M. Kajino, A. Quérel, D. Quélo, H. Kondo, H. Terada, M. Kadowaki, M. Takigawa, Y. Morino, J. Uchida, D. Goto, and H. Yamazawa, 2020: A model intercomparison of atmospheric 137Cs concentrations from the Fukushima Daiichi Nuclear Power Plant accident, phase III: Simulation with an identical source term and meteorological field at 1-km resolution. Atmospheric Environment: X, 7, 100086, doi:10.1016/j.aeaoa.2020.100086.
Fitting precipitation particle size-velocity data to mixed joint probability density function with the expectation maximization algorithm. (Katsuyama and Inatsu 2020)
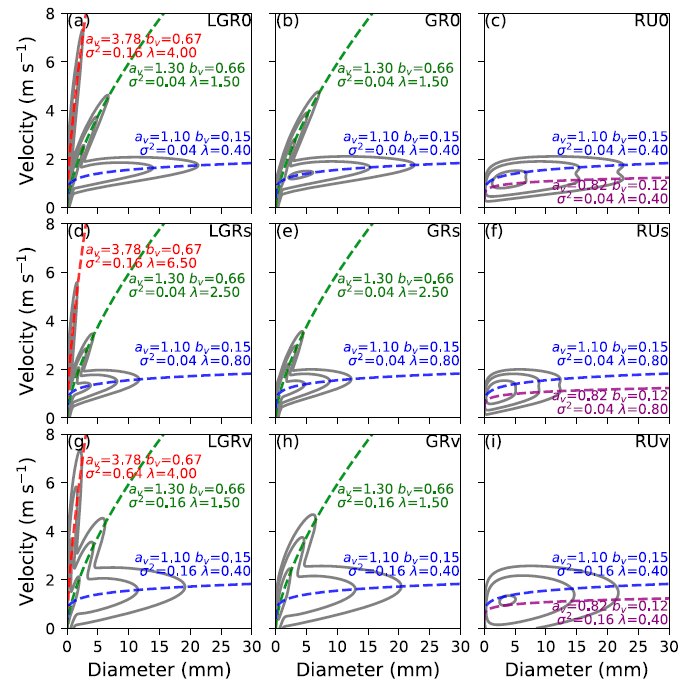
[Abstract] This paper proposes an estimation method of joint size and terminal velocity distribution on the basis of sampling data of precipitation particles containing multiple types. Assuming that the velocity follows the normal distribution and the size follows the gamma distribution, the method searches a locally maximum logarithmic likelihood within a realistic parameter range using the expectation–maximization algorithm. Several test populations were prepared with a realistic number of elements, and then the method was evaluated by retrieving the populations from their sample. The results showed that the original parameters were successfully estimated in most cases of the test population containing some of liquids, graupels, and rimed and unrimed aggregates. The original number of elements was also estimated with an adjustment of the number of elements in a manner such that each of their minority fractions exceeded a threshold. Applied to the two-dimensional disdrometer observation data, the method was helpful to discard frequently observed erroneous data with unrealistically large fall velocity.
[Full reference] Katsuyama, Y., and M. Inatsu, 2020: Fitting precipitation particle size-velocity data to mixed joint probability density function with the expectation maximization algorithm. Journal of Atmosphere and Ocean Technology, 37, 911–925.
Response of snowpack to +2°C global warming in Hokkaido, Japan (Katsuyama et al. 2020)
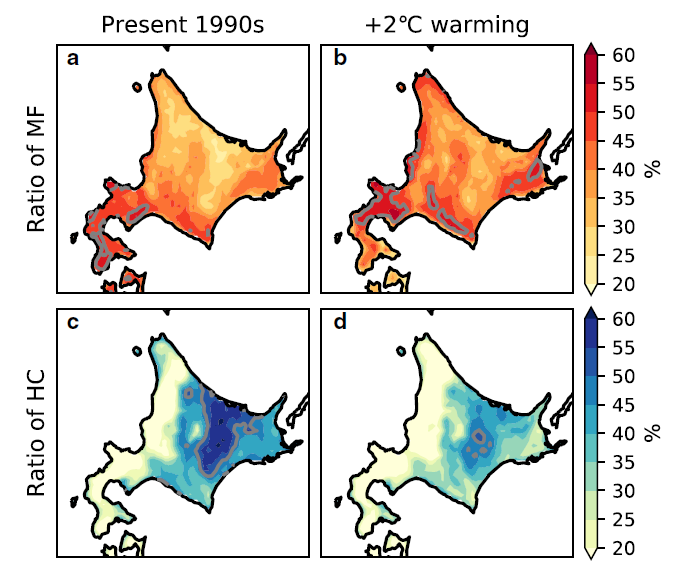
[Abstract] The response of snowpack to a +2°C global warming relative to the present climate was estimated in Hokkaido, Japan, using a physical snowpack model driven by dynamically downscaled (DDS) data, after model evaluation. The evaluation revealed that the snowpack model successfully reproduced the height of snow cover (HS), snow water equivalent (SWE) and snow-covered days (SCDs), but had a moderate bias in the thickness ratios of melt form (MF) and hoar category (HC). The DDS-forced simulation predicted that the seasonal-maximum HS and SWE would decrease by 30–40% in the southwestern and eastern parts of Hokkaido due to a large decrease in snowfall during the accumulation period, and that the HS and SWE in the north would decrease, albeit not significantly due to uncertain atmospheric forcing. The number of SCDs in Hokkaido was predicted to decline by ∼30 d. Additionally, ∼50% of snowpack thickness during a season would be MF in most areas, whereas HC would be < 50% all over Hokkaido.
[Full reference] Katsuyama, Y., M. Inatsu, and T. Shirakawa, 2020: Response of snowpack to +2°C global warming in Hokkaido, Japan. Journal of Glaciology, 66, 83–96.
Research topics published in 2019.
Large dependency of charge distribution in a tropical cyclone inner core upon aerosol number concentration (Sato et al. 2019)
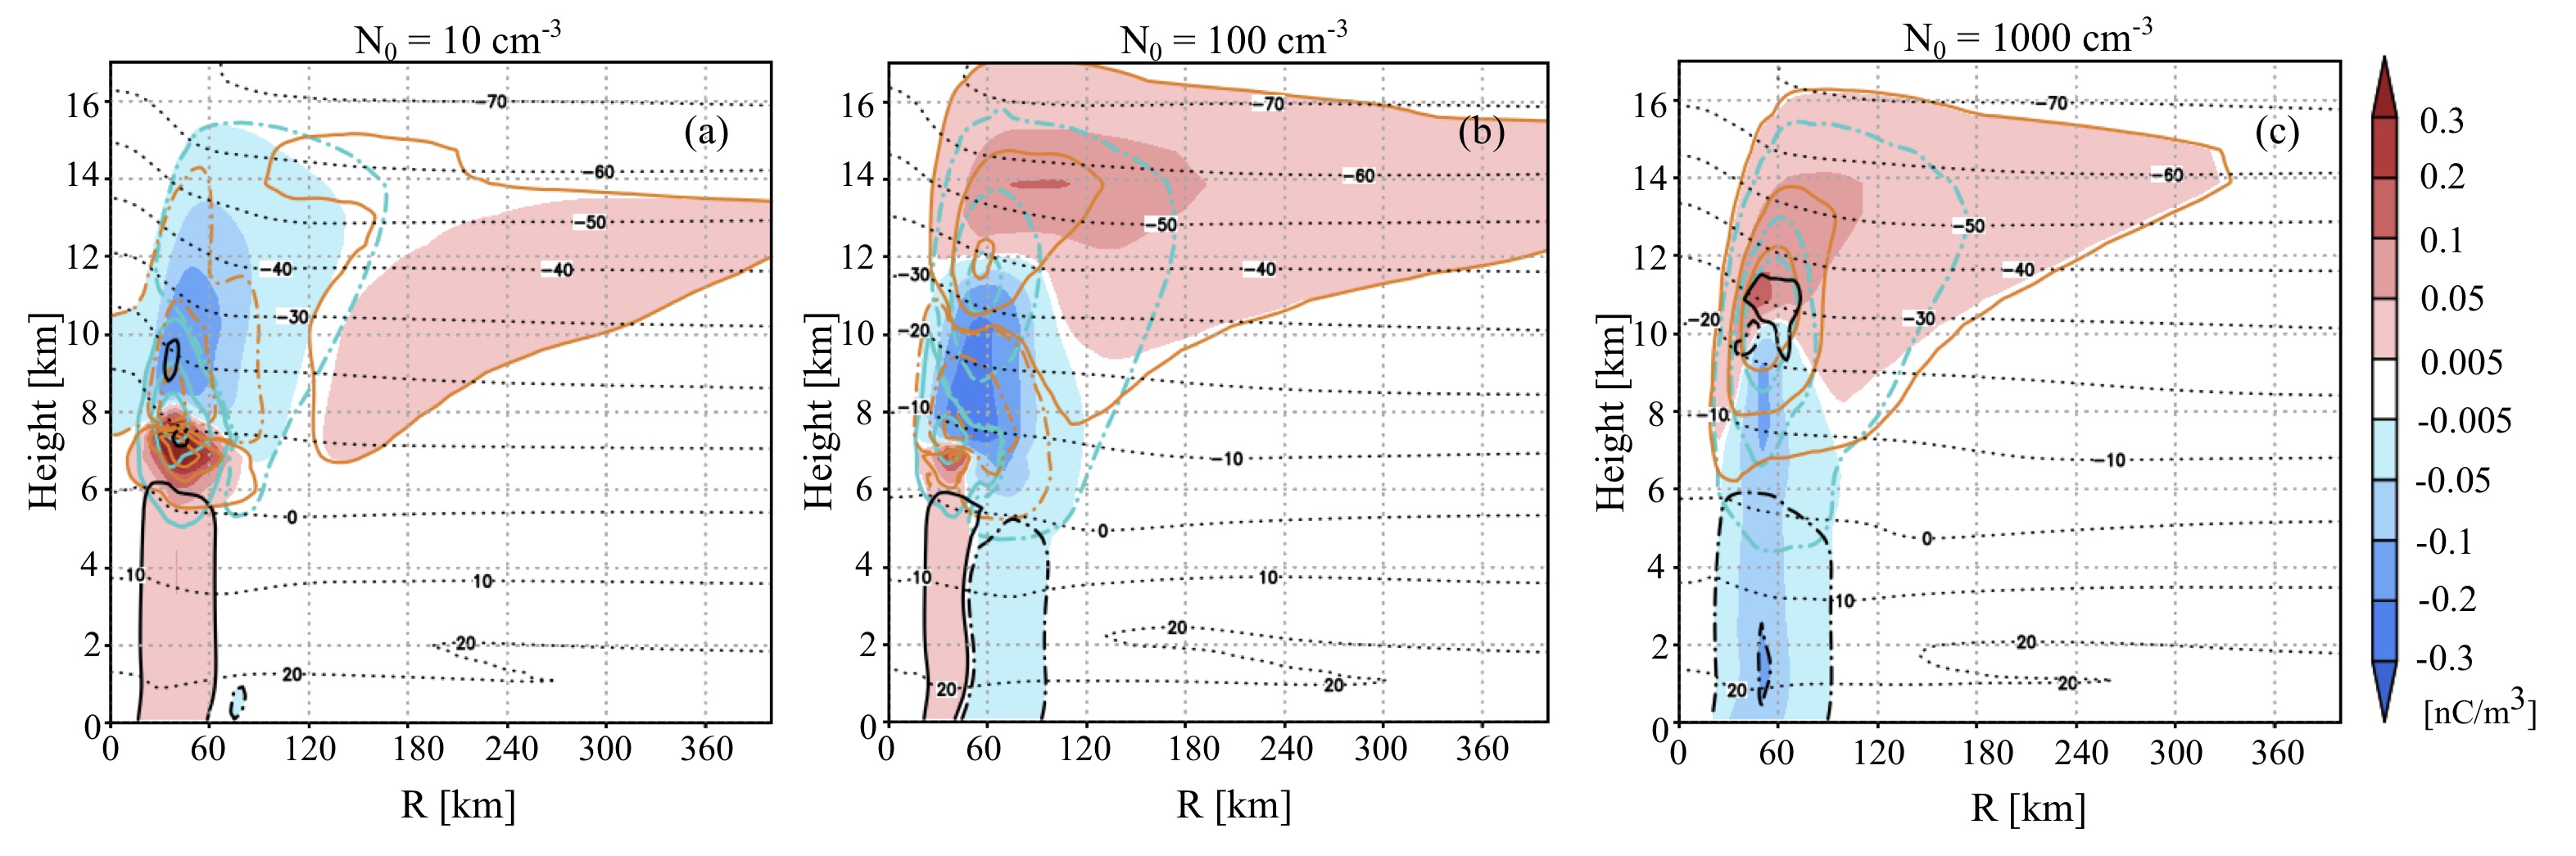
[Abstract] The impacts of aerosols on the charge distribution of hydrometeors and lightning flash density in a tropical cyclone (TC) were investigated using a meteorological model coupled with an explicit lightning model. The meteorological model successfully simulated the tripole structure of charge density distribution in a TC, as reported by previous studies. The impacts of aerosols were investigated through a sensitivity experiment with changing the aerosol number concentration. The tripole structure became unclear with increasing aerosol number concentrations. The positive charge distribution located in the lower layer was not seen, and raindrops with negative charge distribution reached the surface. As a result, the vertical structure of the charge density was dipolar in the polluted case. As the tripole structure shifted to dipole, the magnitude of the electric field tended to be large, and the flash number was large. By contrast, in the pristine case, the tripole structure was dominant, and the flash number was much smaller than in the polluted case.
[Full reference] Sato, Y., Y. Miyamoto, and H. Tomita, 2019: Large dependency of charge distribution in a tropical cyclone inner core upon aerosol number concentration Progress in Earth and Planetary Science, 6(62), doi:10.1186/s40645-019-0309-7
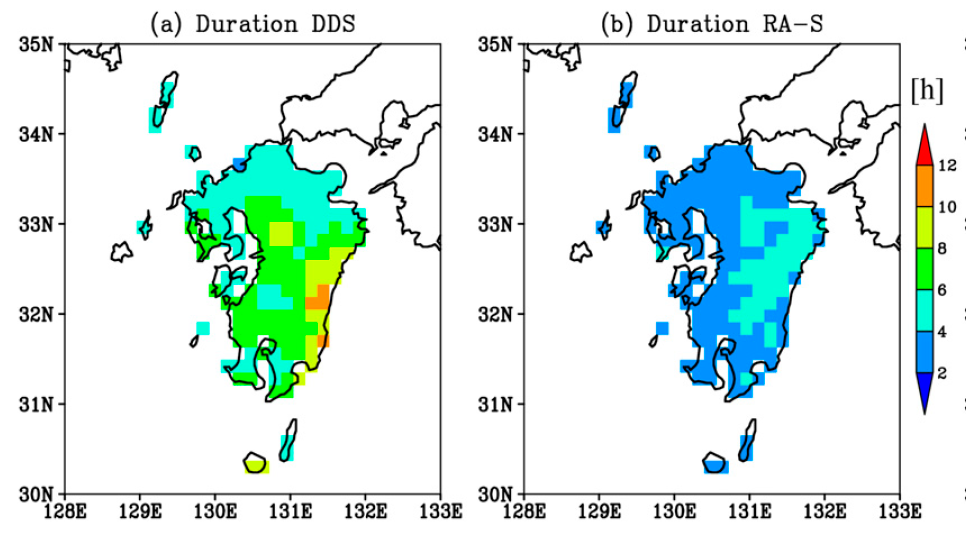
Possible hydrological effect of rainfall duration bias in dynamical downscaling (Tamaki et al. 2019)
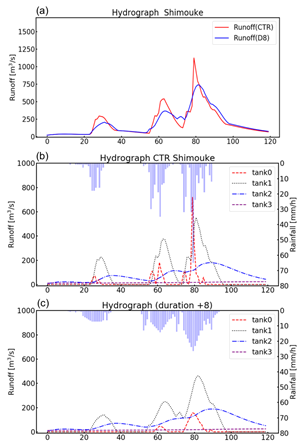
[Background] If a hyetograph with a prolonged bias in rainfall duration is input into a hydrological model, the peak of surface runoff and river-flow amount would be considerably underestimated. The hydrological response to a hyetograph with the rainfall duration bias should be evaluated, and a caveat should be provided in a hydrological estimation based on DDS data particularly in climate change problems.
[Abstract] Motivated from the problem of a rainfall duration bias typically in dynamical downscaling, its possible effect to hydrology was evaluated for heavy rainfall events over Kyushu, Japan, in summer. The heavy rainfall in western Kyushu is related to a persistent Baiu rainband across Kyushu, while the heavy rainfall in eastern Kyushu is related to a typhoon passage near Kyushu. For the typical heavy-rainfall periods, a tank model for several target rivers ran to analyze runoff and water-depth sensitivity to hyetograph, by artificially extending the rainfall duration to 8 hours with keeping the total rainfall amount. The results showed that a spike peak of runoff was suppressed by a prolonged weak rainfall as typically found in downscaling outputs. The rising timing of runoff and water depth in the tank model became earlier.
[Full reference] Tamaki, Y., M. Inatsu, and T. J. Yamada, 2019: Possible hydrological effect of rainfall duration bias in dynamical downscaling. Hydrological Research Letters, 13(4), 55-61
Development of pressure-precipitation transmitter (Inatsu et al. 2019)
[Background] In most extreme-event assessments, the return period of extreme precipitation event is computed from annual-maximum daily precipitation based on a very long-term daily precipitation data and becomes an input parameter for each-sector modeling. For example, in the field of disaster insurance, it is desirable that much infrequent extreme events be evaluated from precipitation data with 10,000 years or longer.
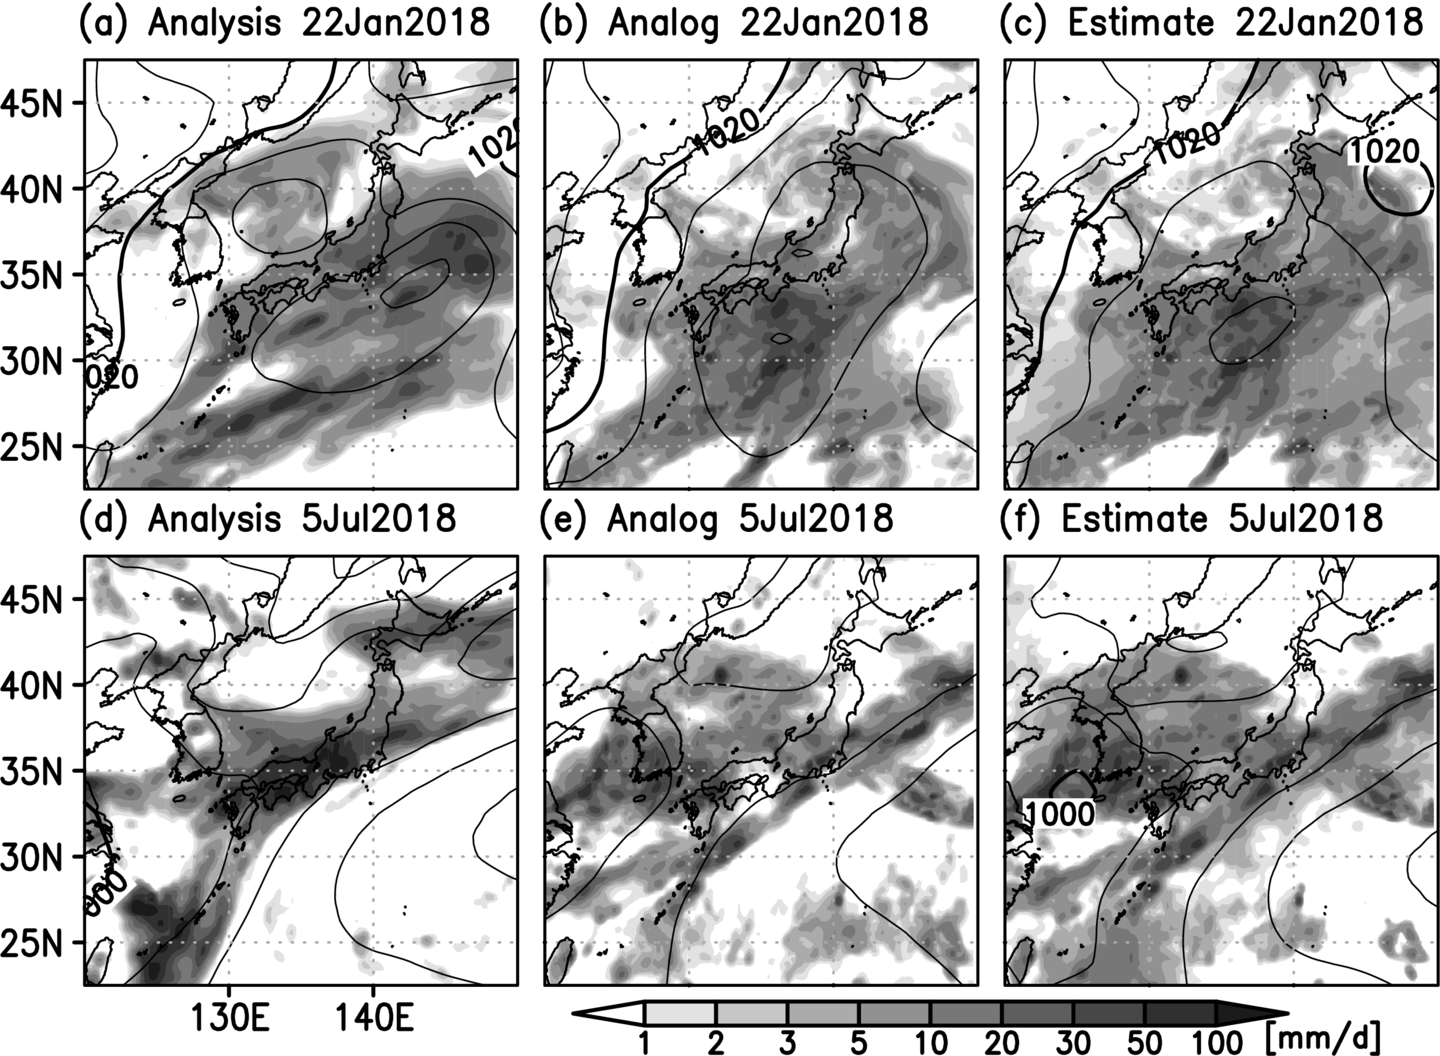
[Abstract] A novel method is proposed to create very long-term daily precipitation data for the extreme statistics, by computing very long-term daily sea-level pressure (SLP) with the SLP Emulator, a statistical multi-level regression model, and then converting the SLP into precipitation by combining statistical downscaling (SDS) methods of the analog ensemble and singular value decomposition (SVD). After a review of the SLP emulator, we present the MLR model constructed for each month based on the time series of 1,000 principal components of SLPs on global reanalysis data. Simple integration of the SLP emulator provides 100-year daily SLP data, which are temporally interpolated into 6-hour interval. Next, the pressure-precipitation transmitter (PPT) is developed to convert 6-hourly SLP to the daily precipitation. The PPT makes its first guess estimate from a composite of time-frames with analogous SLP transition patterns in the learning period. The departure of SLPs from the analog ensemble is then corrected with an SVD relationship between SLPs and precipitation. The final product showed a fairly realistic precipitation pattern, displaying temporal and spatial continuity. The annual maximum precipitation of the estimated 100-year data extended the tail of probability distribution of the 8-year learning data.
[Full reference] Inatsu, M., T. Suematsu, Y. Tamaki, N. Nakano, K. Mizushima, and M. Shinohara, 2019: Development of pressure-precipitation transmitter. Journal of Applied Meteorology and Climatology, 58, 2453–2468.
Mode-decomposed equation diagnosis for atmospheric blocking development (Aikawa et al. 2019)
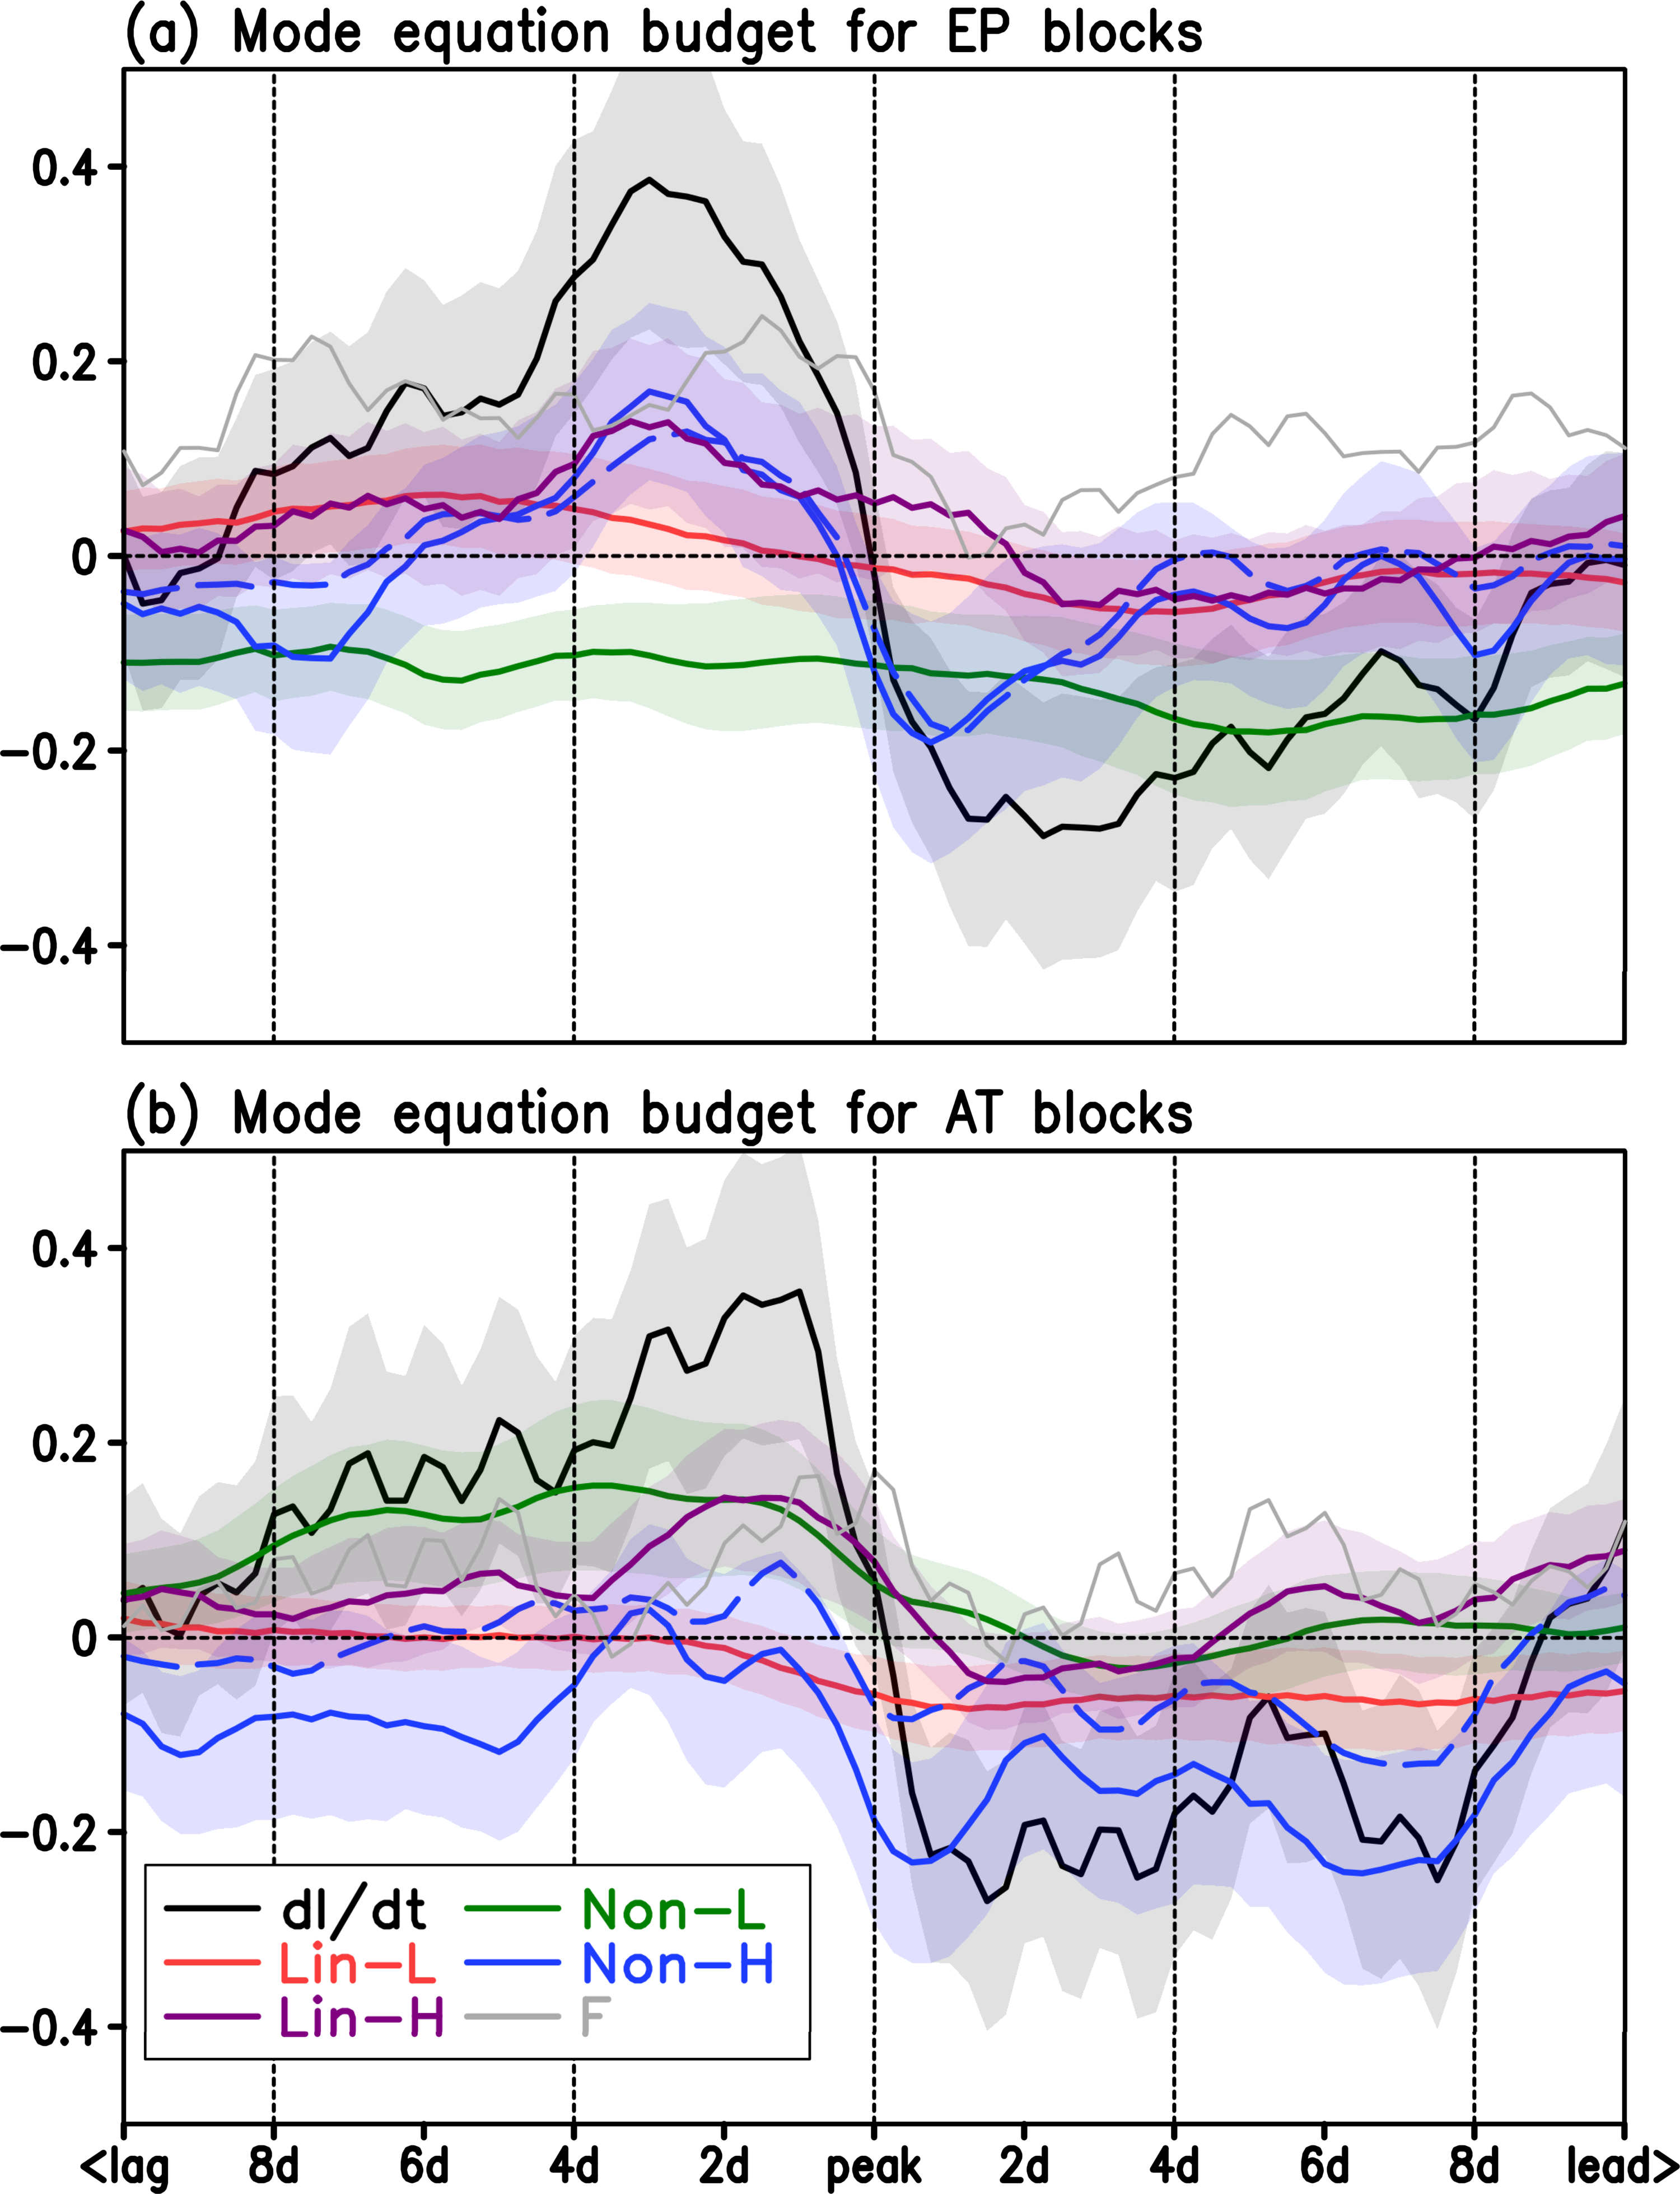
[Background] We developed the mode-decomposed equation by using orthonormality of principal component of geopotential height at 500 hPa of the Northern Hemisphere extratropics in the cold seasons, and applied the equation to atmospheric blocking development.
[Abstract] This study proposes a new method to identify atmospheric blocking development without the time filtering used in previous studies. A mode-decomposed vorticity equation is formulated from the principal components (PCs) of 500-hPa geopotential height by applying a new idea; the orthonormality of PCs allows any variable to be decomposed into a projection corresponding to the PCs. To test this, sectorial blocking episodes in Northern Hemisphere winter were identified by Barriopedro’s method. A blocking index was defined for each longitudinal range as the linear combination of the 10 largest PCs by means of the composite for the blocking episodes. Blocking development was diagnosed, in terms of the low modes of PC1-10 and the high modes of PC11-50. The results suggest that the intensification of blocking over the North Pacific and Eurasia is associated with nonlinear interaction among high modes, whereas the intensification (decay) of North Atlantic blocks is related mainly to enhanced nonlinear interaction among low-frequency (high-frequency) eddies. This main result is insensitive to the choice of definition for blocks and the choice of the mode separation boundary.
[Full reference] Aikawa, T., M. Inatsu, N. Nakano, and T. Iwano, 2019: Mode-decomposed equation diagnosis for atmospheric blocking development. Journal of the Atmospheric Sciences, 76, 3151–3167.
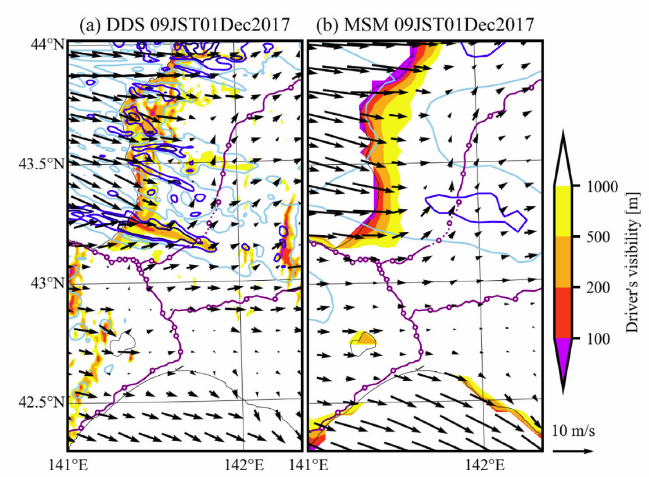
Case study of drifting snow potential diagnosis with dynamical downscaling (Tanji and Inatsu 2019)
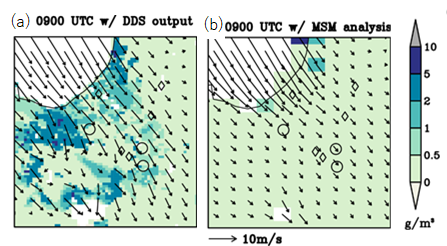
[Background] Blowing snow is mostly a function of surface wind speed, and the dynamical downscaling has an add value for estimating its potential.
[Abstract] Blowing snow potential is diagnosed for typical cases around Sapporo, Japan, as snow concentration and visibility based on dynamically downscaled data with 1-km resolution. The results are consistent with the blowing-snow records on time and place of traffic disruption, when the dynamical downscaling (DDS) reproduced wind speed well for a case. The diagnosis with mesoscale model analysis with 5-km resolution does not reproduce the blowing snow events in most area, however. Hence, the DDS potentially, not perfectly, adds the value to estimate blowing snow potential (Figure), despite a large scale-gap from an explicit representation of small-scale turbulence related to blowing snow. Sensitivity tests clarify that blowing snow requires strong wind and freezing temperature at the surface.
[Full reference] Tanji, S., and M. Inatsu, 2019: Case study of drifting snow potential diagnosis with dynamical downscaling. Scientific Online Letters on the Atmosphere, 15, 32–36.
Research topics published in 2018.
Heavy Rainfall duration bias in dynamical downscaling and its related synoptic patterns in summertime Asian monsoon (Tamaki et al. 2018)
[Background] Dynamical downscaling (DDS) experiment is generally used for hydrological risk assessment. Many people recognise the DDS has a bias of precipitation amount, but this study pointed out the bias of precipitation duration time, which may affect the evaluation of river flow.
[Abstract] DDS was conducted over Japan by using a regional atmospheric model with reanalysis data to investigate the rainfall duration bias over Kyushu, Japan, in July and August from 2006 to 2015. The model results showed that DDS had a positive rainfall duration bias over Kyushu and a dry bias over almost all of Kyushu, which were emphasized for extreme rainfall events (Figure). Investigated was the rainfall duration bias for heavy rainfall days, accompanied by synoptic-scale forcing, in which daily precipitation exceeded 30 mm day-1 and covered over 20% of the Kyushu area. Heavy rainfall days were sampled from observed rainfall data that were based on rain gauge and radar observations. A set of daily climatic variables of horizontal wind and equivalent potential temperature at 850 hPa and sea level pressure, around southwestern Japan, corresponding to the sampled dates, was selected to conduct a self-organizing map (SOM) and K-means method. The SOM and K-means method objectively classified three synoptic patterns related to heavy rainfall over Kyushu: strong monsoon, weak monsoon, and typhoon patterns. Rainfall duration had a positive bias in western Kyushu for the strong monsoon pattern and a positive bias in southern and east-coast Kyushu for the typhoon pattern, whereas there was little rainfall duration bias in the weak monsoon pattern. The bias for the typhoon pattern was related to rainfall events with a strong rainfall peak. The results suggest that bias correction for rainfall duration would be required for accurately estimating direct runoff in a catchment area in addition to the precipitation amount.
[Full reference] Tamaki, Y., M. Inatsu, N.-L. Dzung, and T. J. Yamada, 2018: Heavy-rainfall duration bias in dynamical downscaling and its related synoptic patterns in summertime Asian monsoon. Journal of Applied Meteorology and Climatology, 57, 1477–1496.
Empirical evaluated SDE modelling for dimensionality-reduced systems and its predictability estimates. (Nakano et al. 2018)
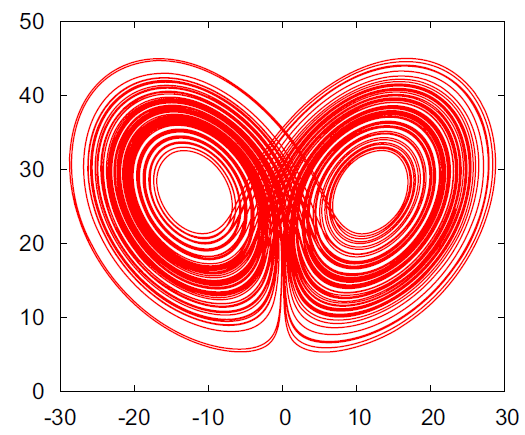
[Background] It is a challenging problem to empirically estimate predictability from data projected onto a low dimensional phase space. We try to make an stochastic differential equation from the long-term data based on a time integtation of the Lorenz model.
[Abstract] This paper develops and validates a method of empirical modelling for a dimensionality-reduced system of a nonlinear dynamical system based on the framework of the stochastic differential equation (SDE). Following the mathematical theorem corresponding to some inverse problem of the probability theory, we derive the empirically evaluating formulae for the drift vector and diffusion matrix. Focusing on a low-dimensional dynamical system of the Lorenz system (Figure), we empirically reconstruct an SDE that approximates the original time-series on the projected 2-dimensional plane. The distribution of the ensemble variance of solutions generated by the numerical SDE well agrees with that of the trajectories of the projected time-series, which indicates the ability of the SDE modelling to represent local predictability. Moreover, we also compare our SDE constructing method with the conventional Mori–Zwanzig projected operator method, which is used to derive a generalised Langevin equation for dimensionality-reduced systems, to assess the applicability of the obtained SDE model derived by the presented method.
[Full reference] Nakano, N., M. Inatsu, S. Kusuoka, and Y. Saiki, 2018: Empirical evaluated SDE modelling for dimensionality-reduced systems and its predictability estimates. Japan Journal of Industrial and Applied Mathematics, 1–37.
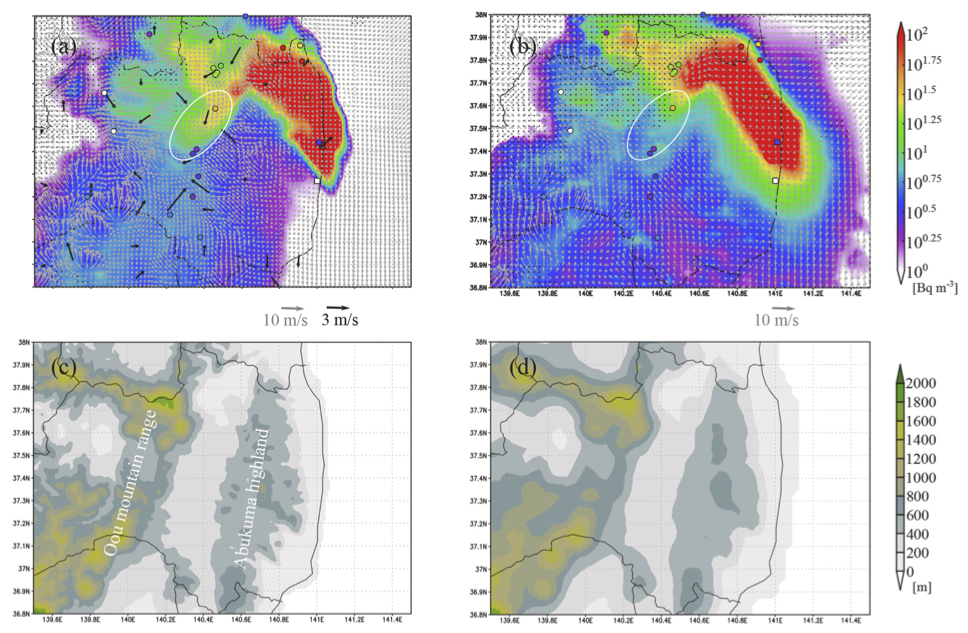
Relative risk assessment for hypothetical radioactivity emission at a snow climate site (Inatsu et al. 2019)
[Background] Atmospheric dispersion-deposition model has been used in the evaluation of radioactive material transport. This study addresses the relative risk assessment for radioactive emission from a nuclear power plant by the hindcast simulation with the model.
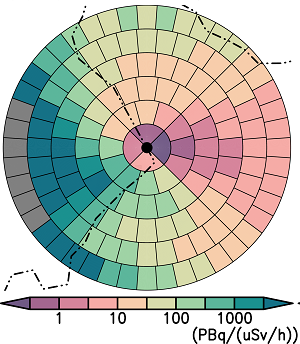
[Abstract] A set of atmospheric dispersion-deposition model integrations was conducted with a hypothetical emission of radioactive materials consisting of 137Cs, 131I, and 134Cs from the Tomari Nuclear Power Plant in Hokkaido, Japan, which is a snow climate site. Each integration was driven by Japan Meteorological Agency’s meso-scale model analysis data with 5-km horizontal resolution. The initial conditions were those on each day from January 2010 to December 2016 and the integration period was at most 4 days. The target was the area within 30 km of the plant. Extending a unit-mass emission concept, the measure of relative risk is the probability of exceeding the threshold of the maximum effective dose rate based only on exposure from groundshine. Considering that the measure increased monotonically with the ratio of the total emission amount to the threshold, we evaluated the probabilistic risk with its median. Figure suggested that the risk was higher in the eastern part of the target area owing to the prevailing westerly flow. The frequent snowfall in winter drags radioactive materials down in the target region, even under an active turbulent condition with strong vertical shear. The composite analysis of wind direction averaged over the target area revealed that the risk was high in the leeside, but that mountains effectively blocked the inflow of the radioactive materials.
[Full reference] Inatsu, M., H. Suzuki, and M. Kajino, 2019: Relative risk assessment for hypothetical radioactivity emission at a snow climate site. Journal of the Meteorological Society of Japan, 97, 175–190.
Research topics published in 2017.
Cyclone identification with persistent homology (Inatsu et al., 2017)
[Background] Synoptic chart draws extratropical cyclones passing over Japan during cold seasons. Several techniques are required to identify them objectively and automatically to meet the intuition of synopticians. This study applied a state-of-the-art image processing technique developed in the topologist to the cyclone identification.
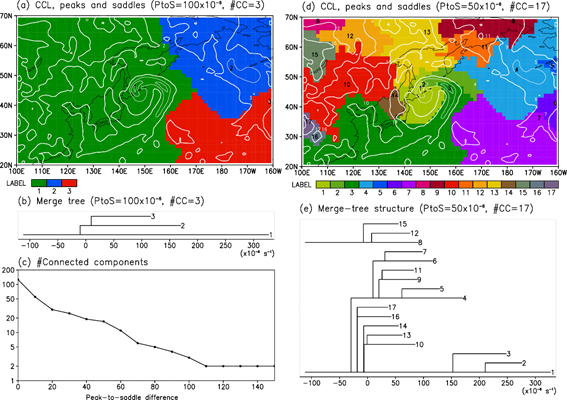
[Abstract] This paper addresses a cyclone identification algorithm with the superlevel set filtration of the persistent homology together with the merge-tree reconstruction of data. Based on the information of peaks and saddles of the scaler field, the newly developed algorithm divides the analysis area into several homology classes, each of which satisfies the peak-to-saddle difference larger than a criterion that should be set in advance. Applied to the 850-hPa relative vorticity in the western North Pacific at 1200 UTC on 2 March 2013, 3 homology classes were found with the criterion of 100x10−6 s−1 and 17 homology classes were found with the criterion of 50x10−6 s−1 (Figure). The merge-tree restructuring clarified the neighbour relation among homology classes. The result suggests that the weak criterion detected too much homology classes, some of which are small peaks inside of a single cyclone. The climatology feature density provides the Pacific storm track with the strict criterion. Finally, a possible way to extend toward cyclone tracking with the persistent homology is discussed.
[Full reference] Inatsu, M., H. Kato, Y. Katsuyama, Y. Hiraoka, and I. Obayashi, 2017: A cyclone identification algorithm with persistent homology and merge-tree. Scientific Online Letters on the Atmosphere, 13, 214–218.
Predictability of Madden Julian Oscillation (Ichikawa and Inatsu, 2017)
[Background] The Madden-Julian Oscillation (MJO), an eastward moving convection signal with the timescale from weeks to months in the tropics, is an important agent of subsesasonal forecast in the extratropics. On the other hand, the potential predictability has been evaluated with the ensemble forecast spread. Because the perfect model is assumed in this method, however, it is not always suitable for phenomena with the model bias like the MJO. This study then developed a new method to evaluate potential predictability without perfect-model assumption.
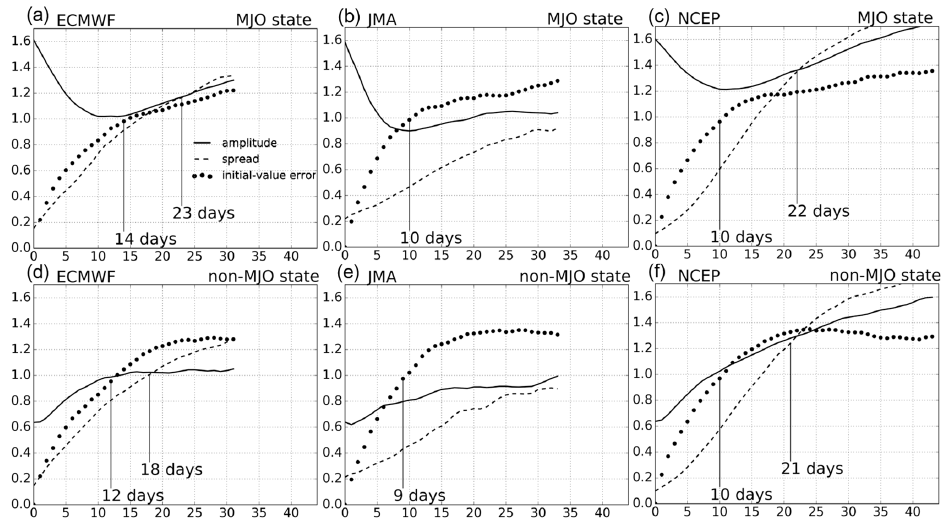
[Abstract] This study proposes an alternative method to estimate the potential predictability without assuming the perfect model. A theoretical consideration relates a maximum possible value of the initial-value error to the covariance between analysis and bias-corrected ensemble-mean forecast. To test the method, the prediction limit of the Madden–Julian Oscillation (MJO) was evaluated, based on three pairs of reanalysis and forecast datasets provided by the European Centre for Medium-Range Weather Forecasting, the Japan Meteorological Agency and the National Centers for Environmental Prediction, participating in the subseasonal-to-seasonal prediction project. The results showed that the predictability was higher when MJO amplitude exceeded unity, consistent with the conventional method in which the error is evaluated as the ensemble-forecast spread (Figure). Moreover, the multimodel analysis was also conducted because the proposed method is readily applicable to the multimodel average of ensemble-mean forecasts. The phase dependency of the MJO's potential predictability is also discussed.
[Full reference] Ichikawa, Y., and M. Inatsu, 2017: An alternative estimate of potential predictability on the Madden-Julian Oscillation phase space using S2S models. Atmosphere, 8, 150.
Global warming response of snowpack (Katsuyama et al., 2017)
[Background] Snowpack brings wintertime disaster but is tourism resource. Global warming may lead to the decrease of snowdepth and change snow quality. The evaluation of them requires some type of simulations. The point is snowpack model that calculates accumulation and ablation, packing, and metamorphosis. This study focuses on Niseko and evaluates snowpack in response to global warming with a snowpack model forced by local climate simulation.
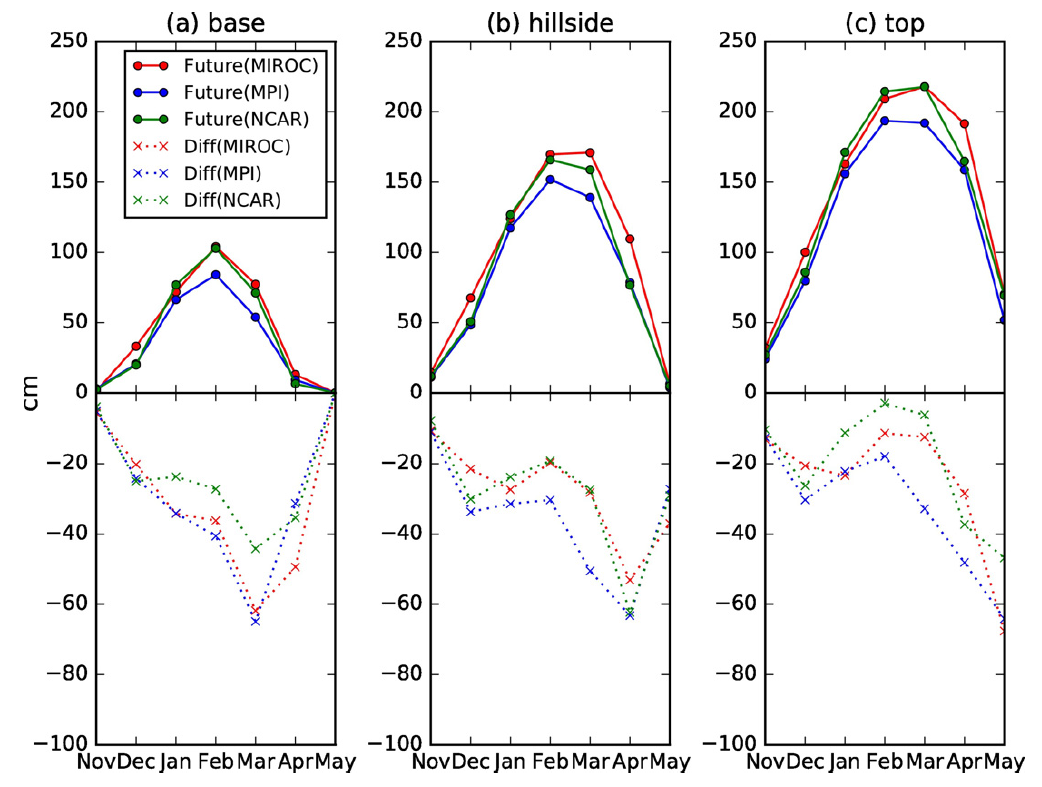
[Abstract] The response of snowpack to globalwarming along with the uncertainty of the snowpack change by using a combination of multiple general-circulation models (GCMs), a single regional atmospheric model, and a one-dimensional multi-layered snowpack model. The target site is Mt. Annupuri in Kutchan, Hokkaido, Japan. The forcing of the snowpack model is taken from dynamically downscaled data from GCMs for the present climate and GCMs in a decade when the global-mean temperature has increased by 2 K from present conditions. The results show that global warming would decrease the monthly-mean snow depth throughout the winter season (Figure). Other salient features are the decrease of snow depth by 60 cm with maximum uncertainty of 20 cm at the beginning of the snow ablation period, the occurrence of the snow-depth peak a month earlier, and the dominance of melt forms in an earlier season. The ratio of melt forms for all snowpack layers increases with little uncertainty before the snow ablation period. The ratio of hoar does not change much, even though the air temperature increases. The uncertainty in snowpack evaluation is also discussed.
[Full reference] Katsuyama, Y., M. Inatsu, K. Nakamura, and S. Matoba, 2016: Global warming response of snowpack at a site in northern Japan estimated using multiple dynamically downscaled data. Cold Region Science and Technology, 136, 62-71.